Urgent Crypto Alert: Bitcoin’s Terrifying Drop Below $80K – Can These 4 Altcoins Offer Hope?
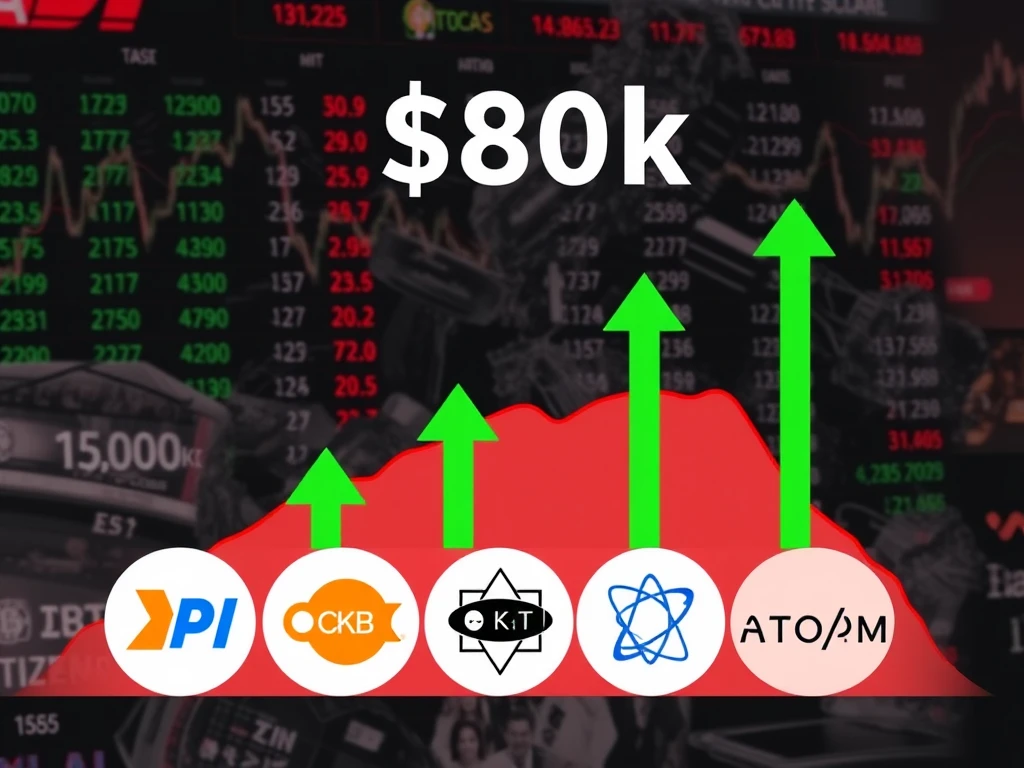
Hold onto your hats, crypto enthusiasts! The market took an unexpected turn as Bitcoin, the king of crypto, dramatically tumbled below the $80,000 mark. Just when we thought BTC was decoupling from traditional markets, this shocking plunge has sparked concerns about a broader crypto sell-off. Is this just a temporary dip, or are we staring down the barrel of a deeper correction? More importantly, amidst this volatility, can certain altcoins like PI, OKB, GT, and ATOM buck the trend and deliver superior returns? Let’s dive into the critical crypto market analysis to decipher what’s happening and what to expect.
Is Bitcoin’s Price Plunge a Warning Sign for Altcoins?
Last week offered a glimmer of hope as Bitcoin price movements seemed to diverge from the turbulent US stock market. While the S&P 500 experienced a steep 9% decline following tariff announcements, Bitcoin remained relatively stable. Some analysts even pointed to gold’s underperformance as a bullish indicator for Bitcoin, suggesting a potential shift in investor preference towards digital gold. However, the recent drop below $80,000 throws a wrench in this optimistic narrative.
The question now is, will this Bitcoin price correction drag the entire crypto market down with it? While Bitcoin showed resilience previously, this sudden fall raises concerns about its ability to remain decoupled if traditional markets face further pressure. Let’s examine the technical charts to understand the critical levels for Bitcoin and what they imply for the broader altcoins market.
Bitcoin Price Technical Analysis: Key Levels to Watch
Despite failing to breach the resistance line, Bitcoin bulls initially showed tenacity by preventing a significant price drop. This suggested underlying buying pressure. However, the current situation demands a closer look at crucial support and resistance levels.
- Current Scenario: The 20-day EMA is flattening, and the RSI is hovering near the midpoint, indicating market equilibrium.
- Bullish Breakout: A decisive break and close above the resistance line could reignite bullish momentum, potentially pushing BTC towards $100,000, with intermediate resistance at $89,000.
- Bearish Breakdown: The critical support level to watch is $80,000. A break below this could trigger a sharp decline towards $76,606, and potentially further to $73,777.
Bitcoin (BTC/USDT) Daily Chart
Source: Crypto News Insights/TradingView
Zooming into the 4-hour chart, we observe a consolidation phase between $81,000 and $88,500. The short-term moving averages are trending downwards, reinforcing the range-bound behavior.
- Near-Term Range: Expect continued fluctuation within the $81,000 – $88,500 range.
- Bullish Trigger: A push above $85,000 could initiate a rally towards $88,500, with potential for further gains to $95,000 if bulls dominate.
- Bearish Control: A break below the $80,000 – $81,000 support zone could empower bears, leading to a potential drop to $76,606.
Bitcoin (BTC/USDT) 4-Hour Chart
Source: Crypto News Insights/TradingView
While Bitcoin navigates these choppy waters, let’s turn our attention to altcoins that might offer refuge or even outperformance during this market uncertainty.
Altcoin Spotlight: Can PI, OKB, GT, and ATOM Defy the Downturn?
Amidst the crypto market analysis indicating potential Bitcoin weakness, several altcoins are showing independent strength. PI Network (PI), OKB, GateToken (GT), and Cosmos (ATOM) are among those that warrant closer examination. But can they truly outperform Bitcoin and other altcoins if the market faces broader selling pressure?
PI Network (PI): Poised for a Reversal?
PI Network has been in a downtrend since its February peak. However, recent price action suggests a potential shift. The relief rally on April 5 indicates buyers are stepping in at lower prices.
- Key Resistance: The 20-day EMA ($0.85) is the immediate hurdle. Overcoming this is crucial for a sustained recovery.
- Bullish Scenario: If PI/USDT holds above the 20-day EMA, it could signal bullish momentum, potentially leading to rallies towards $1.10 (50% Fibonacci retracement) and $1.26 (61.8% Fibonacci retracement).
- Critical Support: The $0.40 level is vital support. A break below this could trigger a deeper correction towards $0.10.
PI Network (PI/USDT) Daily Chart
Source: Crypto News Insights/TradingView
The 4-hour chart reveals bears defending the 50-SMA, but bulls are attempting to hold above the 20-EMA.
- Immediate Battle: Price action around the 20-EMA will be crucial.
- Bullish Momentum: A rebound from the 20-EMA and a break above $0.80 could propel PI/USDT towards $1.20.
- Bearish Pressure: A break below the 20-EMA could intensify selling, potentially retesting the $0.40 support.
PI Network (PI/USDT) 4-Hour Chart
Source: Crypto News Insights/TradingView
OKB: Attempting a Bullish Comeback?
OKB showed strong upward movement on April 4, breaking above moving averages, suggesting a potential bullish reversal.
- Immediate Target: The descending channel resistance line is the next major hurdle, likely to attract sellers.
- Consolidation Scenario: A sharp rejection at the resistance line and a break below $54 could lead to continued range-bound trading within the channel.
- Bullish Breakout Potential: Sustained buying pressure near the resistance line increases the likelihood of a channel breakout, potentially targeting $64 and $68.
OKB (OKB/USDT) Daily Chart
Source: Crypto News Insights/TradingView
The 4-hour chart hints at an inverted head-and-shoulders pattern formation.
- Pattern Confirmation: A break and close above the neckline would complete the bullish pattern, with a potential target of $70.
- Neckline Support: If buyers flip the neckline into support after a breakout attempt, it strengthens the bullish case.
- Bearish Defense: Sellers need to defend the neckline and push the price below the 20-EMA to negate the bullish setup, potentially leading to a drop towards $45.
OKB (OKB/USDT) 4-Hour Chart
Source: Crypto News Insights/TradingView
GateToken (GT): Holding Key Support
GateToken has found support at the 50-day SMA ($22.05), a crucial level for bulls to defend.
- Neutral Indicators: Flat moving averages and RSI near the midpoint indicate indecision in the market.
- Bullish Trigger: A break and close above $23.18 could spark a rally towards $24, and potentially $26 if resistance is overcome.
- Bearish Risk: A break and hold below the 50-day SMA would invalidate the bullish outlook, potentially leading to declines towards $20.79.
GateToken (GT/USDT) Daily Chart
Source: Crypto News Insights/TradingView
The 4-hour chart shows rejection at the descending channel resistance, indicating selling pressure on rallies.
- Channel Trading: Expect GT/USDT to remain within the descending channel in the short term.
- Bullish Breakout Signal: A break and close above the channel resistance would signal the end of the corrective phase, potentially leading to rallies towards $24.
GateToken (GT/USDT) 4-Hour Chart
Source: Crypto News Insights/TradingView
Cosmos (ATOM): Bottoming Out or Range-Bound?
Cosmos is attempting to establish a bottom but faces resistance at $5.15. Bulls are showing some strength by holding above moving averages.
- Bullish Sign: A strong rebound from moving averages would indicate buying on dips and increase the chances of breaking above $5.15 resistance.
- Upside Targets: A successful breakout could propel ATOM/USDT towards $6.50 and $7.17.
- Range-Bound Scenario: A break below moving averages could lead to a range-bound market between $4.15 and $5.15.
- Bearish Control: A slide below $4.15 would give bears the upper hand.
Cosmos (ATOM/USDT) Daily Chart
Source: Crypto News Insights/TradingView
On the 4-hour chart, a battle is ongoing around the 20-EMA.
- Bearish Pressure: Sustained price action below the 20-EMA could lead to a drop towards the 50-SMA and $4.15 support.
- Bullish Defense: Holding above the 20-EMA indicates strong demand at lower levels, increasing the chances of a rally towards $5.15.
- Breakout Potential: A break and close above $5.15 could initiate a new upward trend.
Cosmos (ATOM/USDT) 4-Hour Chart
Source: Crypto News Insights/TradingView
Navigating the Volatile Crypto Market
The recent crypto market analysis reveals a mixed bag. Bitcoin’s sudden drop below $80,000 has injected uncertainty, but several altcoins like PI, OKB, GT, and ATOM are exhibiting resilience and potential for independent growth.
Key Takeaways:
- Bitcoin’s Direction is Crucial: Monitor Bitcoin’s price action around $80,000 and key resistance levels to gauge overall market sentiment.
- Altcoin Opportunities Exist: Despite market volatility, select altcoins are showing strength and potential for outperformance.
- Technical Analysis is Your Friend: Utilize technical charts and key support/resistance levels to make informed trading decisions.
- Risk Management is Paramount: Always remember that crypto investments carry risk. Conduct thorough research and manage your portfolio wisely.
Actionable Insight: While caution is warranted given Bitcoin’s recent dip, keep a close watch on PI, OKB, GT, and ATOM. A break of key resistance levels in these altcoins could present compelling trading opportunities, even if Bitcoin continues to experience volatility. However, always prioritize risk management and never invest more than you can afford to lose.
Disclaimer: This article is for informational purposes only and should not be considered investment advice. Cryptocurrency trading involves substantial risk of loss.