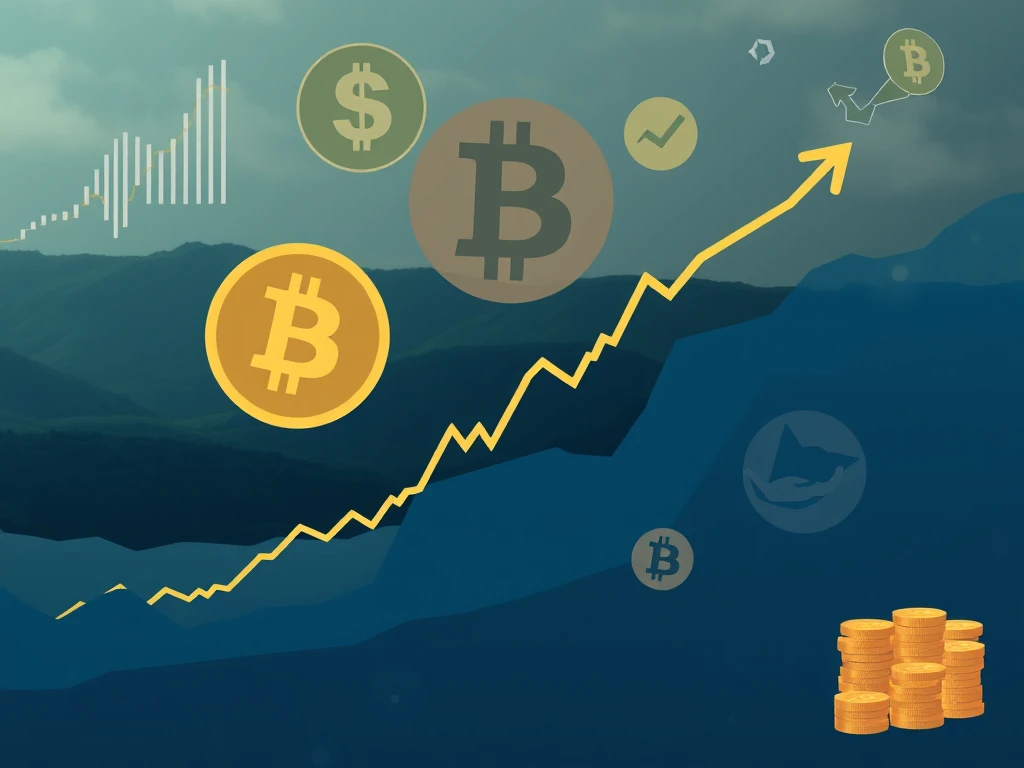
Bitcoin Price: Bullish Patterns and HODL Mode Point to Potential All-Time High
Is the next major move for Bitcoin price upon us? Recent technical signals and a notable shift in market behavior suggest that Bitcoin could be gearing up for a significant rally, potentially challenging its previous all-time high.
Understanding the Bullish Signals on the Bitcoin Chart
Analyzing the Bitcoin chart provides key insights into potential future price movements. After finding support around $100,300, Bitcoin broke out from a descending trendline. On the weekly chart, a Doji candle formed, absorbing recent selling pressure. This candle, with its small body and long wicks, indicates market indecision but often precedes large moves. Absorption below the candle suggests sellers might be exhausted, setting the stage for an upward push.
Crypto analyst Jackis noted that while the weekly Doji is interesting, confirmation is needed. A break higher is required to validate its bullish implications, similar to patterns seen in the past, though context differs.
Adding to the positive outlook is a bullish fractal pattern identified by trader Krillin. This pattern mirrors Bitcoin’s price action following the spot ETF approval in early 2024 and includes a ‘god candle’ element, historically indicating strong upward potential. Such higher timeframe fractals have a good track record in forecasting trend shifts.
The Return of ‘HODL Mode’ and Market Dynamics
Beyond the Bitcoin chart, market sentiment is increasingly bullish, marked by a return to ‘HODL mode’. Data shows a significant drop in average spot trading volumes on centralized exchanges, reaching levels not seen since late 2020. This decline, while futures trading remains elevated, points to investors preferring to hold rather than actively trade, a characteristic of accumulation phases that often precede rallies.
Onchain analysis further supports this narrative by examining the behavior of different holder groups. Short-term holders (those holding BTC for less than 155 days) have distributed a considerable amount of BTC as the BTC price approached $110,000. Conversely, long-term holders have actively accumulated over 600,000 BTC since the all-time high. This divergence suggests that strong hands are absorbing the supply released by newer or less convicted holders, providing structural support for the ongoing uptrend.
What Could This Mean for the BTC Price?
Based on the combination of technical patterns and holder behavior, analysts suggest that Bitcoin is positioned for a move towards higher price levels. The fractal analysis points to a potential push towards $110,000-$120,000. If these technical patterns are confirmed and the accumulation trend continues, challenging the previous all-time high becomes a realistic possibility in the near term.
Conclusion: Is a New All-Time High Imminent?
The confluence of bullish signals from the Bitcoin chart, including a potential Doji confirmation and a repeating fractal pattern, alongside the clear shift towards ‘HODL mode’ driven by strong long-term holder accumulation, paints a compelling picture for the future Bitcoin price. While caution is always advised and market confirmation is necessary, the current conditions suggest that Bitcoin is building a solid foundation for a potential rally that could see it reach a new all-time high sooner rather than later.
Please remember, this article is for informational purposes only and does not constitute investment advice. Always conduct your own research before making investment decisions.


