Urgent: Binance Staked SOL (BNSOLUSDT) Price Action Signals Bearish Reversal

The world of cryptocurrency trading is a whirlwind of rapid movements, and Binance Staked SOL (BNSOLUSDT) recently offered a prime example of this volatility. For traders and investors alike, understanding these swift shifts is crucial for navigating the market successfully. Our latest analysis delves into the recent 24-hour session of BNSOLUSDT, providing a clear picture of its price action and what it could mean for your portfolio.
Decoding the Recent BNSOLUSDT Price Analysis
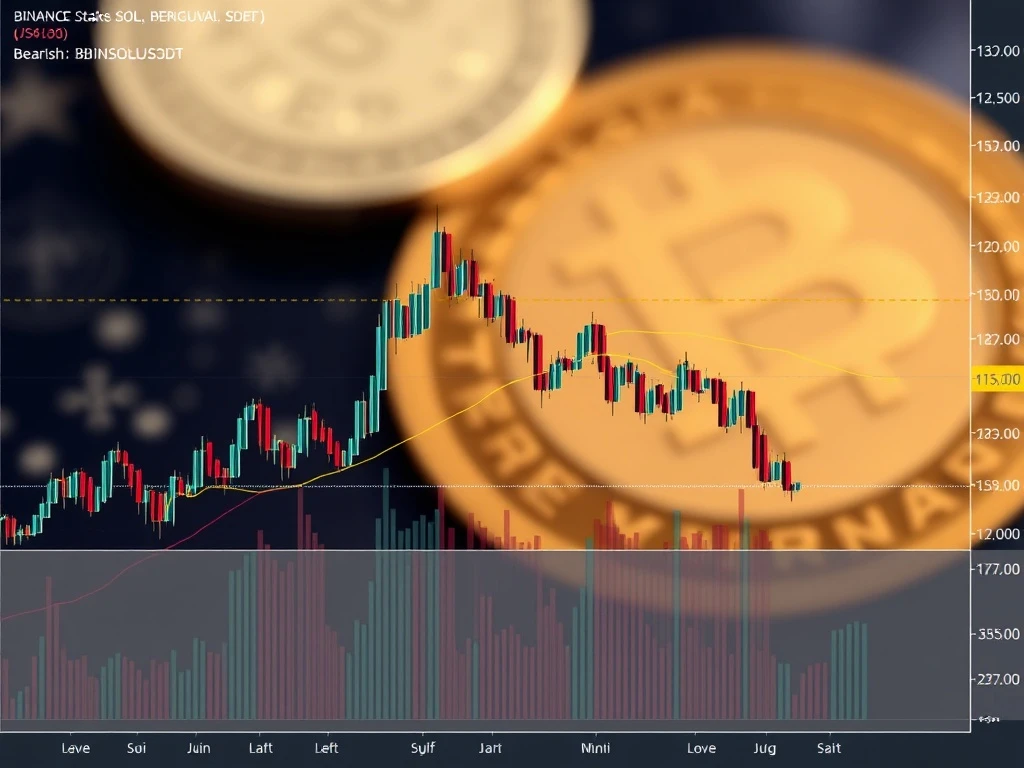
The past 24 hours for BNSOLUSDT Price Analysis have been nothing short of dynamic, revealing significant shifts for Binance Staked SOL. The session commenced at $199.3, saw a peak at $200.6, and concluded at $199.1. This seemingly small range belies a session marked by notable volatility and a strong bearish reversal in its closing hours. Volume surged to 116.4k at the close, yet uneven turnover suggests mixed conviction among market participants. This divergence between volume and price movement often signals caution.
What Are the Key Bearish Reversal Crypto Signals?
Traders constantly look for signs of momentum shifts, and bearish reversal crypto patterns are critical indicators. For BNSOLUSDT, price started in consolidation before a bullish push to $200.6. However, this peak was swiftly met with a bearish engulfing pattern, signaling potential exhaustion among buyers. A doji candle near $199.3 further highlighted market indecision. Key support levels have emerged at $198.0 and $197.0, while resistance lingers around $199.8 and $200.0. Monitoring these levels will be crucial for short-term price movements.
Deep Dive into SOL Technical Analysis
A thorough SOL Technical Analysis involves scrutinizing various indicators to gauge market sentiment and predict future movements.
- Moving Averages: The 15-minute chart showed a bearish crossover between the 20-period and 50-period moving averages, with price closing below both. While the daily chart maintains a generally bullish bias (50-period MA above 200-period MA), this short-term divergence warrants attention.
- MACD & RSI: MACD turned negative in the final hours, with its histogram narrowing and the signal line crossing below the MACD line, confirming a bearish momentum shift. RSI, which was in overbought territory, dropped to a neutral range around 50, indicating weakening bullish pressure.
- Bollinger Bands: The bands tightened mid-day, preceding a downside breakout. Price closed near the lower band, suggesting continued bearish momentum. The upper band at $199.8-$200.0 could act as resistance, while the lower band may test $197.0.
- Fibonacci Retracements: For the recent 15-minute swing from $197.0 to $200.6, price closed near the 61.8% retracement level at $199.0, suggesting potential near-term support. On the daily chart, the 38.2% retracement from $196.4 to $200.6 at $198.9 has been a significant pivot.
Navigating the Broader Crypto Market Overview
While the focus is on Binance Staked SOL, understanding the broader crypto market overview is essential. BNSOLUSDT’s recent bearish signals, if sustained, could reflect or influence wider market sentiment. The uneven turnover, despite high volume, suggests that while selling pressure was present, there wasn’t overwhelming conviction behind the move. This could mean the downward trend might lack strong follow-through without broader market validation. Investors should remain vigilant, watching for macro economic indicators or significant news that could impact the entire crypto landscape.
The recent price action for Binance Staked SOL (BNSOLUSDT) presents a cautionary tale for traders. The confluence of bearish technical signals – from the engulfing pattern and moving average crossovers to the MACD and RSI shifts – points towards potential continued downward pressure, especially if the $197.0 support level breaks. However, the mixed volume and turnover signals suggest that this bearish move might not be as robust as it appears without broader market validation. As always, diligent monitoring of key support and resistance levels, alongside a keen eye on overall market sentiment, remains paramount for making informed trading decisions in this dynamic environment.
Frequently Asked Questions (FAQs)
What is Binance Staked SOL (BNSOLUSDT)?
Binance Staked SOL (BNSOLUSDT) is a tokenized version of staked Solana (SOL) on the Binance platform, allowing users to earn staking rewards while maintaining liquidity. Its price reflects the value of SOL and market dynamics.
What does a bearish engulfing pattern indicate for BNSOLUSDT?
A bearish engulfing pattern is a strong reversal signal where a large bearish candle completely covers the previous bullish candle. For BNSOLUSDT, it indicates that sellers have taken control, potentially leading to further price declines.
How do Moving Averages and RSI impact BNSOLUSDT’s price outlook?
Moving Averages (MAs) help identify trend direction. A bearish crossover (short-term MA crossing below long-term MA) suggests a downtrend. The Relative Strength Index (RSI) measures momentum; a drop below 50 from overbought levels indicates weakening bullish momentum and increasing selling pressure.
What are the key support and resistance levels for BNSOLUSDT?
Based on recent price action, key support levels are identified at $198.0 and $197.0. Resistance levels, where upward movement might be halted, are around $199.8 and $200.0. These levels are critical for traders to watch for potential price reversals or continuations.
Is the current bearish trend for BNSOLUSDT likely to continue?
While technical indicators suggest potential continued downward pressure, especially if BNSOLUSDT breaks below $197.0, the mixed volume and turnover signals indicate that the bearish move might not have strong conviction. Broader market confirmation is needed for a sustained trend.
How does volume and turnover impact BNSOLUSDT’s price action?
High volume accompanying a price move typically confirms the strength of that move. However, uneven turnover with high volume, as seen in BNSOLUSDT’s session, suggests mixed conviction. This means the bearish move, despite the volume, might lack strong follow-through as buyers and sellers are still somewhat balanced in their overall sentiment.


