Unveiling BNSOLUSDT: Binance Staked SOL’s Crucial Market Moves & Technical Analysis

Are you tracking the dynamic world of crypto assets? Binance Staked SOL (BNSOLUSDT) has certainly made headlines with its recent impressive rally. In the 24 hours leading up to July 26, 2025, this derivative asset, representing staked Solana on Binance, demonstrated significant volatility and price movements that demand a closer look. Understanding these shifts is crucial for anyone navigating the digital asset landscape.
Binance Staked SOL: A Glimpse into Recent Performance
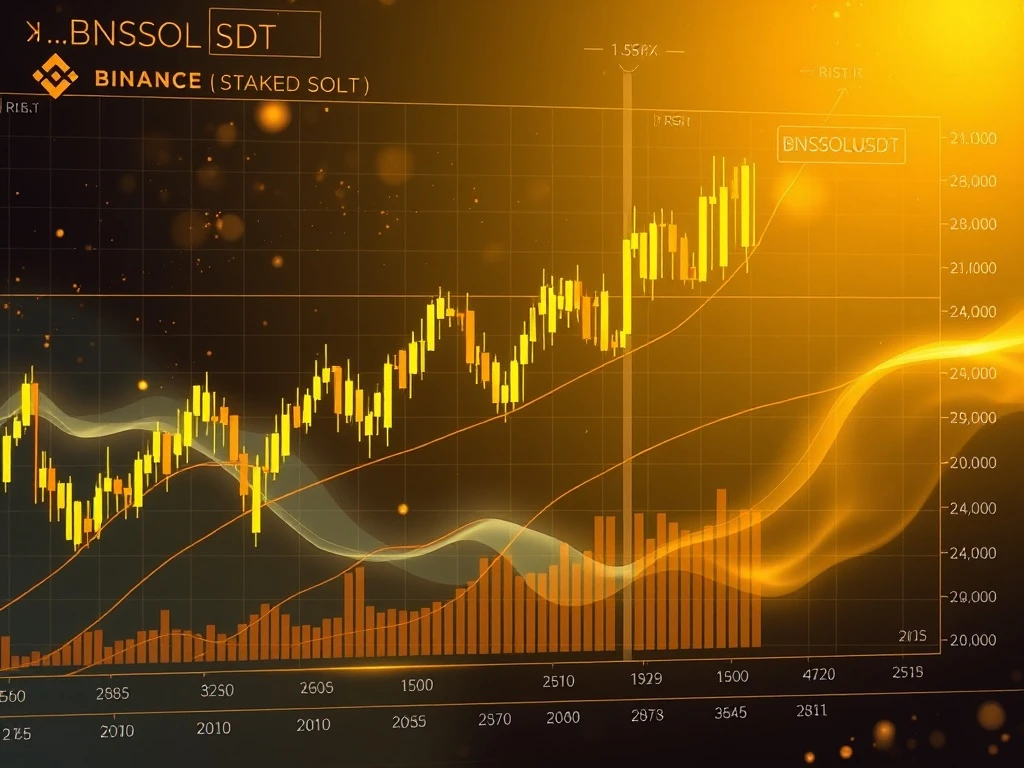
The past 24 hours have been eventful for Binance Staked SOL. The asset initiated a strong rally, climbing from an opening price of $188.1 on July 25, 2025, at 12:00 ET, to reach a peak of $200.9. This upward momentum showcased significant buying interest. Following this surge, BNSOLUSDT experienced a period of consolidation, settling near $199.8 by the close of the 24-hour period on July 26, 2025, at 12:00 ET. This movement highlights a dynamic market, where rapid gains are often followed by periods of price discovery and stabilization.
The total 24-hour trading volume for BNSOLUSDT reached 3,214.96 tokens, translating to a substantial turnover of $634,867. Such volume confirms active participation from traders and investors, validating the observed price action.
Decoding BNSOLUSDT Price Action: Breakouts and Consolidation
Analyzing the recent movements of BNSOLUSDT Price reveals a clear bullish trend. The asset successfully broke above a significant resistance level at $199.0, a move that typically signals a continuation of an uptrend. This breakout was followed by a period of consolidation, forming a key support zone around $198.0–$199.0. Several candles emerged within this range, indicating a battle between buyers and sellers attempting to establish a new equilibrium.
A notable observation was the appearance of a doji candle in the early afternoon (14:45 ET). This candlestick pattern often suggests market indecision, where opening and closing prices are nearly identical, indicating that neither buyers nor sellers gained significant control during that period. Understanding these subtle cues in BNSOLUSDT Price action is vital for anticipating future movements.
What Do Crypto Market Overview Indicators Tell Us?
A comprehensive Crypto Market Overview requires examining various technical indicators. For BNSOLUSDT, several signals provide insights into its current health and potential future direction:
- Moving Averages: On the 15-minute chart, the 20-period Moving Average (MA) crossed above the 50-period MA, confirming a short-term bullish bias. On the daily timeframe, the 50-period MA is nearing the 100-period MA, which could signal a continuation of the broader bullish trend if a golden cross occurs.
- MACD & RSI: The Moving Average Convergence Divergence (MACD) line crossing above its signal line in the morning reinforced the bullish momentum. However, the Relative Strength Index (RSI) reached overbought territory, exceeding 70 for several hours. This suggests that the upward momentum may be unsustainable without a price correction.
- Bollinger Bands: The Bollinger Bands expanded significantly during the rally, reflecting increased volatility. The price closed near the upper band at $199.8, often an indication that the current move might be losing steam and could precede a reversal or consolidation.
- Volume & Turnover: Volume surged during the morning breakout, peaking at 613.5 tokens at 14:45 ET. This spike confirmed the strength of the price action. However, volume declined notably in the afternoon and evening, suggesting potential profit-taking or a lack of sustained buying interest.
Here’s a quick summary of what the indicators are suggesting:
| Indicator | Current Signal | Implication |
|---|---|---|
| RSI | Overbought (>70) | Potential for pullback or consolidation |
| MACD | Bullish Cross | Confirms short-term upward momentum |
| Bollinger Bands | Widening, Price near Upper Band | Increased volatility, possible exhaustion of rally |
| Moving Averages | Short-term bullish cross | Confirms immediate bullish bias |
| Volume | Surged then Faded | Breakout confirmed, but waning interest/profit-taking |
Deep Dive: SOL Technical Analysis and Key Levels
A crucial part of any SOL Technical Analysis involves identifying key support and resistance levels. Applying Fibonacci retracement levels to the recent $188.1–$200.9 swing provides valuable insights into potential price corrections and targets. The 61.8% Fibonacci retracement level sits at $198.2, which aligns perfectly with the observed consolidation zone in the afternoon. This level acts as a critical pivot point.
- Key Support: The immediate support zone is $198.0–$199.0, reinforced by the 61.8% Fibonacci level at $198.2. A break below this level could signal a deeper correction.
- Next Support Targets: If $198.2 fails to hold, the next significant support would be the 50% Fibonacci level at $194.5. Traders should monitor these levels closely for potential bounces.
- Resistance & Upside Targets: The immediate resistance is the recent high of $200.9. A decisive move above this level could lead to a test of the $201.6–$202.0 range, potentially opening the door for further upward movement.
These levels are not merely numbers; they represent areas where significant buying or selling pressure is likely to emerge, shaping the asset’s trajectory.
Crafting Your BNSOL Trading Strategy: What’s Next?
Given the current market dynamics, what should be your BNSOL Trading Strategy? The rally in BNSOLUSDT shows signs of reaching overbought conditions, coupled with waning volume. This suggests that a short-term pullback into the $198.0–$199.0 range is a strong possibility before any further sustained gains.
For traders, key actionable insights include:
- Monitor Support Levels: Watch for a retest of the $198.0–$199.0 support zone. A strong bounce from this area, accompanied by renewed volume, could signal a healthy consolidation before another leg up.
- Confirm with Volume: Be cautious if the price attempts to break above $200.9 without significant accompanying volume. A lack of volume could indicate a false breakout or a bull trap.
- Risk Management: Given the overbought RSI, consider potential pullbacks as opportunities for entry or re-entry, rather than chasing the current price. Conversely, be prepared for a deeper correction if key support levels fail to hold.
- Stay Informed: Keep an eye on broader market sentiment and any news related to Solana or Binance Staking, as these can impact BNSOLUSDT’s performance.
The market is always evolving, and a flexible strategy that adapts to new information is key to navigating its complexities.
The recent surge in Binance Staked SOL (BNSOLUSDT) highlights its potential, but current technical indicators suggest caution. While the bullish breakout was strong, overbought conditions and declining volume point towards a likely pullback or consolidation phase. Investors and traders should remain vigilant, carefully monitoring key support and resistance levels, particularly the $198.0–$199.0 range, and confirm any future price action with robust volume. Understanding these market signals is essential for making informed decisions in the dynamic crypto space.
Frequently Asked Questions (FAQs)
What is Binance Staked SOL (BNSOLUSDT)?
Binance Staked SOL (BNSOLUSDT) is a derivative asset representing Solana (SOL) that has been staked on the Binance platform. It allows users to earn staking rewards while maintaining liquidity, as BNSOL can be traded on the open market.
What caused the recent BNSOLUSDT price rally?
The recent rally in BNSOLUSDT from $188.1 to $200.9 was driven by strong buying interest, leading to a bullish breakout above key resistance levels. This momentum was initially confirmed by a surge in trading volume.
What do technical indicators suggest for BNSOLUSDT’s immediate future?
Technical indicators suggest a potential pullback. The RSI is in overbought territory, and volume has declined after the initial surge, indicating that the rally may be losing momentum. Bollinger Bands also show widening, which can precede a reversal or consolidation.
What are the key support and resistance levels for BNSOLUSDT?
The immediate key support zone for BNSOLUSDT is around $198.0–$199.0, with the 61.8% Fibonacci retracement level at $198.2. The primary resistance level is the recent high of $200.9, with potential upside targets around $201.6–$202.0.
Is BNSOLUSDT currently overbought?
Yes, the Relative Strength Index (RSI) for BNSOLUSDT has been above 70 for several hours, indicating that the asset is currently in overbought territory. This condition often suggests that a price correction or consolidation is likely in the near term.
What should traders watch for in BNSOLUSDT’s near future?
Traders should closely watch for a retest of the $198.0–$199.0 support range. Confirmation of any future price movements with strong trading volume is crucial. A bounce from support with renewed volume would be a bullish sign, while a break below it could signal a deeper correction.


