Bitcoin Price Surges 11% to $65K: The Strategic Dip Buyers Revealed

Global cryptocurrency markets witnessed a dramatic reversal on Friday, May 23, 2025, as Bitcoin (BTC) staged an impressive 11% recovery to reclaim the $65,000 level. This significant rebound followed a harrowing drop to 15-month lows below $60,000, which triggered over $2.6 billion in market-wide liquidations. Consequently, the critical question now emerging from this volatility is: which market participants seized the sub-$60,000 Bitcoin as a strategic buying opportunity?
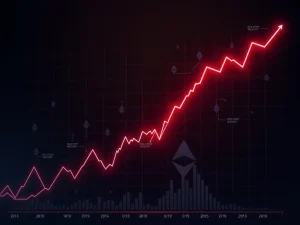
Bitcoin Price Rebound: Analyzing the $6,000 Recovery
Bitcoin’s price action this week presented a textbook case of extreme market volatility. The leading cryptocurrency initially plunged to approximately $59,000 on Thursday, erasing gains accumulated over the previous 15 months. This move represented a staggering 50% decline from its all-time high of $126,000, recorded on October 6, 2025. The sharp downturn triggered massive liquidations across cryptocurrency derivatives markets, particularly impacting leveraged long positions.
Data from analytics platform CoinGlass quantified the damage precisely. Over a 24-hour period, total crypto liquidations approached $2.6 billion. Long positions bore the brunt of this, accounting for $2.15 billion of the total. Specifically, Bitcoin long liquidations alone reached $1.1 billion, highlighting the intensity of the sell-off. However, the market narrative shifted rapidly on Friday as Bitcoin demonstrated remarkable resilience, climbing steadily to stabilize above $65,000.
The Institutional Response to Market Stress
This recovery was not driven by retail sentiment alone. Instead, substantial evidence points toward calculated institutional accumulation during the downturn. Market analysts observed distinct buying patterns that suggested sophisticated investors were actively entering positions at perceived value levels. The rapid rebound from the $59,000 zone indicates strong underlying demand, despite the prevailing fear and uncertainty that dominated trading sessions just hours earlier.
Identifying the Dip Buyers: Institutions Step Forward
Several major players have publicly confirmed their accumulation strategies during Bitcoin’s recent decline. Their actions provide crucial insight into how professional capital navigates cryptocurrency market corrections.
Binance’s SAFU Fund: The exchange’s Secure Asset Fund for Users executed a notable purchase of 3,600 BTC, valued at approximately $250 million, at an average price near $65,000. This transaction represents part of a broader, pre-announced strategy. Last week, Binance revealed plans to convert $1 billion of its SAFU reserve assets into Bitcoin over the next 30 days. The fund had already acquired an initial batch of 1,315 BTC earlier in the week.
Crypto Hedge Fund Activity: Data from asset manager Bitwise reveals increased market exposure among global cryptocurrency hedge funds. André Dragosch, European Head of Research at Bitwise, reported that the aggregate market beta across these funds reached its highest level in two years precisely as Bitcoin weakened. This metric signals that professional funds were systematically increasing their Bitcoin holdings, interpreting the price drop as a buying signal rather than a reason for panic.
Spot Bitcoin ETF Flows: Despite net outflows from U.S.-based spot Bitcoin ETFs on Thursday, record trading volumes suggested substantial internal churn. Analysts interpret this activity as evidence of dip-buying within the ETF structure itself, where authorized participants and market makers likely added to positions at lower prices to meet underlying demand.
Technical Analysis: Key Support Levels and Market Structure
Traders are now closely monitoring several critical technical levels to gauge whether Bitcoin has established a durable bottom or faces further downside risk.
The $58,000 – $62,000 Zone: Multiple analysts identify this range as a crucial area of interest. Prominent trader Jelle emphasized that Bitcoin must hold this zone to prevent a deeper correction. The region represents previous cycle highs that have now transitioned into potential support, a common phenomenon in Bitcoin’s market structure.
The 200-Week Moving Average: Currently positioned near $58,000, this long-term trend indicator has historically acted as a formidable support level during bear markets. Michael van de Poppe, founder of MN Capital, highlighted its importance, noting that Thursday’s high-volume price candle might represent a capitulation event. Such events often create long wicks on charts and signal potential trend reversals when they occur at key technical levels.
The following table summarizes the key technical levels and their significance:
| Price Level | Technical Significance | Current Status |
|---|---|---|
| $58,000 | 200-Week Moving Average & Previous Cycle High | Major Support |
| $59,000 – $60,000 | Recent Swing Low & Psychological Level | Tested Support |
| $62,000 | Upper Bound of Demand Zone | Intermediate Resistance/Support |
| $65,000 | Post-Rebound Stabilization | Current Trading Zone |
Market Context and Historical Precedents
Bitcoin’s current price action occurs within a broader historical context. Corrections of 50% or more from all-time highs are not uncommon in Bitcoin’s volatile history. For instance, the 2021-2022 cycle saw multiple drawdowns exceeding 50% before the asset eventually reached new highs. Therefore, seasoned investors often view these deep corrections as necessary market resets that create long-term buying opportunities.
Furthermore, the involvement of institutional entities like Binance’s SAFU fund and regulated hedge funds marks an evolution in market participation. Their presence introduces a layer of strategic capital that typically operates with longer time horizons and greater risk management frameworks than retail traders. This development may contribute to increased market stability over time, even if it does not eliminate volatility entirely.
The Role of Derivatives and Liquidation Cascades
The recent $2.6 billion liquidation event underscores the continued influence of leveraged derivatives trading on Bitcoin’s price discovery. While these instruments provide liquidity and hedging capabilities, they also create fragility during rapid price movements. The cascade of long liquidations below $60,000 likely exacerbated the downward move, creating the oversold conditions that ultimately attracted dip buyers. This pattern highlights the self-correcting nature of liquid markets, where extreme fear often precedes opportunity.
Conclusion
The Bitcoin price rebound to $65,000 demonstrates the cryptocurrency market’s complex interplay between fear, leverage, and strategic accumulation. While the plunge to $59,000 liquidated over $1.1 billion in Bitcoin longs and wiped out 15 months of gains, it simultaneously created a compelling entry point for institutional buyers. Entities like Binance’s SAFU fund and crypto hedge funds increased their market exposure, betting on Bitcoin’s long-term value proposition. Moving forward, the $58,000 to $62,000 zone will serve as a critical technical battleground. Whether Bitcoin consolidates above this support or revisits lower levels will depend largely on macroeconomic factors and continued institutional interest. Ultimately, this week’s volatility reaffirms that deep corrections remain a feature of the crypto landscape, often followed by powerful recoveries driven by those willing to buy the dip.
FAQs
Q1: Why did Bitcoin’s price drop to $59,000?
The drop resulted from a combination of factors including market over-leverage, macroeconomic uncertainty, and a cascade of long position liquidations in the derivatives market that accelerated the sell-off.
Q2: Who are the main buyers during this dip?
Primary buyers include institutional entities like Binance’s SAFU insurance fund, global cryptocurrency hedge funds increasing their market beta, and likely participants within the spot Bitcoin ETF ecosystem.
Q3: What is the significance of the $58,000 level?
The $58,000 level aligns with Bitcoin’s 200-week moving average and previous cycle highs, making it a major technical support zone that has historically contained bear markets.
Q4: How much was liquidated during the market downturn?
Approximately $2.6 billion was liquidated across the crypto market in 24 hours, with $2.15 billion from long positions and $1.1 billion specifically from Bitcoin longs.
Q5: Is this a good time to buy Bitcoin?
This article does not provide investment advice. Every investment involves risk. Readers should conduct their own research and consider their risk tolerance, as cryptocurrency markets remain highly volatile and unpredictable.