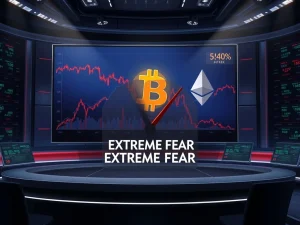
Bitcoin Crashes Below $63K: Stunning $1.5B Liquidation Echoes FTX Collapse Fears as XRP Plunges 19%

Global cryptocurrency markets experienced a severe contraction on Friday, March 14, 2025, as Bitcoin’s price violently crashed below the $63,000 support level, triggering the largest single-day liquidation event since the collapse of the FTX exchange in November 2022. Consequently, over $1.5 billion in leveraged positions was wiped from the market, while XRP led altcoin losses with a staggering 19% plunge. This event immediately sent shockwaves through digital asset portfolios and reignited debates about market maturity and systemic risk.
Bitcoin Crash Below $63,000: Analyzing the Market Mechanics
The sell-off began during early U.S. trading hours, accelerating rapidly as Bitcoin breached several key technical support levels. Market data from major exchanges shows the flagship cryptocurrency dropping over 10% in a 24-hour window, a magnitude not witnessed since the aftermath of the FTX bankruptcy. Specifically, the cascade of liquidations created a self-reinforcing feedback loop. Margin calls forced the automatic selling of collateral, which then drove prices lower and triggered further liquidations. This mechanism is a hallmark of highly leveraged markets and underscores the persistent volatility within the crypto ecosystem. Furthermore, the rapid decline erased gains from the previous weeks, pushing Bitcoin back to a price territory last seen in late February.
The Liquidation Cascade and Derivative Market Impact
Analysts point to derivative markets as the primary amplifier of the downturn. Exchange liquidation heatmaps revealed massive clusters of long leverage positioned just above $65,000. When the price dipped through this level, it initiated a domino effect. The total liquidated volume surpassed $1.5 billion, with long positions accounting for the overwhelming majority. For context, this single-day liquidation figure represents a significant spike in market stress. A comparison with recent history illustrates the severity:
| Event | Date | Approx. 24-Hr Liquidation | Bitcoin Price Drop |
|---|---|---|---|
| FTX Collapse | Nov 2022 | ~$2.5B | ~20% |
| Current Event | Mar 2025 | ~$1.5B | ~10%+ |
| China Ban News | Sep 2021 | ~$2.0B | ~12% |
This data highlights how derivative instruments, while providing liquidity, can also exacerbate price moves during periods of uncertainty.
XRP Plunge and Broader Altcoin Carnage
While Bitcoin led the decline, the altcoin market suffered disproportionately. XRP experienced a particularly sharp correction, plummeting 19% against the U.S. dollar. This underperformance is often attributed to several factors common in risk-off crypto environments:
- Higher Beta Sensitivity: Altcoins like XRP typically exhibit higher volatility (beta) relative to Bitcoin.
- Liquidity Flight: Traders often flee to perceived safety, selling altcoins first to cover losses or margin calls in core positions.
- Market Sentiment: Negative sentiment toward one major asset frequently spills over into the entire digital asset class.
Other major cryptocurrencies, including Ethereum (ETH), Solana (SOL), and Cardano (ADA), also posted double-digit percentage losses. The broad-based nature of the sell-off confirmed it was a systemic market event rather than an issue isolated to a single blockchain or project.
Contextual Triggers and Macroeconomic Pressures
Market participants and institutional analysts cited a confluence of triggers for the downturn. Firstly, a stronger-than-expected U.S. Producer Price Index (PPI) report renewed fears of persistent inflation, dampening investor appetite for risk assets globally. Secondly, net outflows from major spot Bitcoin Exchange-Traded Funds (ETFs) after a sustained period of inflows suggested a shift in institutional sentiment. Additionally, technical analysis indicated that Bitcoin had failed to break through a key resistance zone near its all-time high, leading to profit-taking and a reversal of momentum. These factors combined to create a “perfect storm” of selling pressure.
Historical Parallel: Comparisons to the FTX Collapse Fallout
The immediate comparison to the FTX collapse is inevitable, yet critical distinctions exist. The November 2022 crash was fundamentally driven by the revelation of massive fraud and the insolvency of a top-three exchange, which created a crisis of confidence in counterparty security across the industry. Conversely, the March 2025 event appears rooted in traditional market forces: macroeconomic data, derivative market mechanics, and technical price action. However, the similar scale of liquidations reminds investors that crypto markets remain susceptible to violent deleveraging events, regardless of the catalyst. This event demonstrates that while the industry has matured with ETF adoption and institutional infrastructure, it has not fully decoupled from its volatile nature.
Expert Analysis on Market Structure and Future Implications
Financial analysts specializing in digital assets note that such drawdowns, while severe, are not uncommon in Bitcoin’s history. They often serve to flush out excessive leverage and reset market sentiment. The key metric to watch in the coming days will be whether the $60,000 support level holds. A sustained break below could signal a deeper correction toward the next major support zone. Conversely, a swift recovery would indicate strong underlying demand from long-term holders and institutions. Regulators are likely to scrutinize the role of high leverage offered by unregulated offshore exchanges in amplifying the downturn, potentially leading to renewed calls for stricter oversight in derivative markets.
Conclusion
The Bitcoin crash below $63,000 and the accompanying $1.5 billion liquidation event represent a significant stress test for the cryptocurrency market in 2025. While the rapid decline draws stark comparisons to the FTX collapse era, the underlying causes appear more aligned with traditional financial market dynamics—macroeconomic pressures and derivative unwinding. This episode starkly highlights the continued volatility and leverage risks inherent in the asset class, even as institutional adoption progresses. For investors, it reinforces the importance of risk management, appropriate position sizing, and understanding the mechanics of liquidation cascades. The market’s response in the coming week will be crucial in determining whether this is a healthy correction or the start of a more sustained bearish trend.
FAQs
Q1: What caused the Bitcoin price to crash below $63,000?
The crash was triggered by a combination of factors: stronger-than-expected U.S. inflation data, net outflows from spot Bitcoin ETFs, a failure to break key technical resistance, and a massive cascade of long position liquidations in derivative markets.
Q2: Why is this drop compared to the FTX collapse?
The comparison is made due to the similar magnitude of the single-day price decline and the scale of leveraged positions liquidated (~$1.5B). However, the FTX event was caused by fraud and insolvency, while this appears driven by traditional market forces.
Q3: How much was liquidated in total during the crash?
Approximately $1.5 billion worth of leveraged cryptocurrency positions were liquidated across exchanges within a 24-hour period, with the vast majority being long bets on prices rising.
Q4: Why did XRP drop more than Bitcoin?
XRP and other altcoins typically have higher volatility (beta). In risk-off market events, traders often sell these assets first due to lower liquidity and a flight to more established assets like Bitcoin, amplifying their losses.
Q5: What happens after a major liquidation event like this?
Markets often experience heightened volatility as positions are rebalanced. It can flush out excessive leverage, potentially creating a more stable foundation. The key is to watch major support levels (like $60,000 for Bitcoin) to gauge if the sell-off is continuing or finding a bottom.