XRP Price Analysis: Glassnode’s Ominous Pattern Echoes 2022’s Devastating 68% Crash
January 2025 – A chilling technical pattern has emerged in XRP’s on-chain data, triggering alarm among cryptocurrency analysts worldwide. Glassnode, the premier blockchain analytics platform, has identified a rare fractal signal in XRP’s market structure that bears striking resemblance to the configuration preceding the cryptocurrency’s devastating 68% collapse in early 2022. This development arrives amid broader market uncertainty and significant institutional repositioning, creating a perfect storm of technical and fundamental pressures on Ripple’s native token.
Glassnode’s Technical Analysis Reveals Troubling Parallels
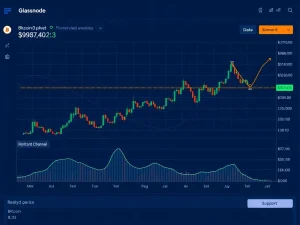
Glassnode’s latest on-chain data presents compelling evidence of structural similarities between current XRP market conditions and those observed in February 2022. The analytics firm employs sophisticated blockchain metrics that track investor behavior, token movement patterns, and market psychology indicators. According to their comprehensive analysis, four critical elements align with the 2022 pre-crash environment, suggesting potential vulnerability in XRP’s current price structure.
The primary concern centers on a rare fractal pattern in XRP’s price and volume dynamics. This technical formation mirrors the exact structure that preceded the massive correction from February to May 2022, when XRP plummeted from $0.78 to $0.30. Market technicians define fractal patterns as repeating geometric shapes that occur across different time scales, often signaling similar market outcomes. The reappearance of this specific pattern after nearly three years represents a significant technical warning that professional traders cannot ignore.
Critical Support Levels Under Pressure
Historical comparison reveals disturbing parallels in support level breaches. In 2022, the loss of the $0.78 support level triggered cascading sell orders that accelerated XRP’s decline. Currently, the $2.00 threshold serves as an analogous psychological and technical barrier. Glassnode data indicates that each breach below this level has generated weekly realized losses between $500 million and $1.2 billion, creating substantial emotional pressure on market participants.
The analytics platform further identifies an emerging imbalance between investor cohorts. Long-term holders who acquired XRP between six and twelve months ago now face a challenging situation where their average purchase cost exceeds current market prices. This creates potential for panic selling if psychological thresholds break, as these investors may seek to limit further losses. The concentration of underwater positions among committed holders represents a particular vulnerability during market stress periods.
Institutional Sentiment Shifts Through ETF Flows
Beyond technical indicators, institutional behavior provides additional context for XRP’s current predicament. Recent data from XRP exchange-traded funds reveals concerning outflow patterns that align with the technical warnings. On Tuesday, January 21, 2025, XRP ETFs recorded their second consecutive day of net outflows since their market introduction, totaling $53.32 million in withdrawn capital.
This outflow represents the largest single-day withdrawal since the ETFs launched, surpassing the $40 million recorded on January 7. The consistent pattern of institutional disengagement suggests a broader reassessment of XRP’s near-term prospects among professional investors. ETF flows serve as a transparent indicator of institutional sentiment, and the current trend toward capital withdrawal reflects growing caution in the professional investment community.
The relationship between ETF flows and price action creates a potential feedback loop. As institutions reduce exposure through ETF redemptions, market makers must sell underlying XRP holdings to meet withdrawal requests. This selling pressure can accelerate technical breakdowns, particularly when combined with retail investor concerns about the Glassnode patterns. The convergence of these factors creates a challenging environment for XRP price stability.
Historical Context and Market Psychology
Understanding the 2022 comparison requires examining market conditions during that period. The cryptocurrency market faced multiple headwinds in early 2022, including Federal Reserve policy shifts, regulatory uncertainty, and broader macroeconomic concerns. XRP’s specific challenges included ongoing legal proceedings between Ripple and the SEC, creating additional uncertainty for investors.
Current market psychology shows similarities to that period, with investors displaying heightened sensitivity to technical breakdowns. Glassnode’s data reveals that psychological pressure on bullish investors increases significantly when XRP fails to defend the $2.00 threshold. This level has transformed from a simple price point into a strategic marker of market confidence. Historical precedent suggests that breaching such psychologically important levels can trigger disproportionate selling responses.
The May 2022 experience provides a specific case study. When XRP broke below $0.55 during that period, the cryptocurrency experienced a 48% decline within weeks. Technical analysts note that similar percentage declines from current levels would target the $1.10 to $1.03 range, coinciding with the 200-week moving average. This long-term trend indicator often serves as critical support during bear market phases, making its proximity to potential downside targets particularly noteworthy.
On-Chain Metrics and Investor Behavior Analysis
Glassnode’s analysis extends beyond simple price comparisons to examine underlying blockchain activity. The platform tracks realized losses, which measure the value destroyed when investors sell tokens below their acquisition price. Recent data shows these losses reaching significant magnitudes during XRP’s declines below $2.00, indicating substantial pain among recent buyers.
The concentration of losses among specific investor cohorts provides additional insight. Glassnode identifies particular vulnerability among investors who purchased during the 2024 rally, as their cost basis now exceeds current market prices. This creates potential for accelerated selling if these investors reach their psychological breaking points. Historical patterns suggest that such concentrated pain points often precede capitulation events.
Network activity metrics offer further context for XRP’s current situation. Transaction volumes, active address counts, and network utilization rates all contribute to understanding underlying demand dynamics. While technical patterns provide warning signals, fundamental network usage ultimately determines long-term value. Analysts must balance short-term technical concerns with longer-term adoption metrics when assessing XRP’s prospects.
Regulatory Environment and Market Structure
The current regulatory landscape differs significantly from 2022 conditions, potentially influencing market outcomes. Ripple’s partial legal victories against the SEC have created clearer regulatory parameters for XRP’s status. However, broader cryptocurrency regulation remains evolving, creating ongoing uncertainty for institutional participants.
Market structure developments since 2022 may also influence how technical patterns play out. The introduction of XRP ETFs, increased institutional participation, and growing derivatives markets have changed how price discovery occurs. These structural changes could potentially dampen or amplify the effects of technical patterns identified by Glassnode. Market participants must consider both the similarities and differences between current conditions and the 2022 environment.
Potential Scenarios and Risk Management Considerations
Technical analysts outline several potential scenarios based on the Glassnode patterns. The primary concern involves a clear break below the $2.00 support level with sustained volume, which could trigger algorithmic selling and stop-loss orders. In this scenario, analysts identify the $1.10 to $1.03 range as a probable target, representing declines of 45-50% from current levels.
Alternative scenarios include range-bound consolidation above $2.00 or a successful defense of this critical level followed by gradual recovery. Historical patterns suggest that fractal signals sometimes fail to produce expected outcomes, particularly when fundamental conditions differ significantly from previous occurrences. The unique regulatory clarity surrounding XRP compared to 2022 represents one such differentiating factor.
Risk management considerations become paramount when such technical warnings emerge. Professional traders typically employ position sizing adjustments, stop-loss orders, and hedging strategies when facing similar historical patterns. Retail investors should consider similar precautions while avoiding panic reactions. Diversification across asset classes and careful assessment of personal risk tolerance remain essential practices during periods of technical uncertainty.
Broader Market Context and Correlations
XRP’s technical patterns exist within broader cryptocurrency market conditions that influence individual asset performance. Bitcoin and Ethereum market dynamics often establish directional bias for the entire sector, creating correlation patterns that can amplify or mitigate individual asset movements. Current market conditions show elevated correlations among major cryptocurrencies, suggesting that XRP’s fate remains tied to broader sector trends.
Macroeconomic factors including interest rate expectations, inflation data, and geopolitical developments continue influencing cryptocurrency markets alongside technical patterns. The Federal Reserve’s monetary policy trajectory, particularly regarding potential rate cuts or continued tightening, represents a significant variable for all risk assets including cryptocurrencies. These macroeconomic considerations provide essential context for interpreting technical patterns identified by Glassnode.
Conclusion
Glassnode’s identification of a concerning XRP pattern reminiscent of the 2022 crash environment warrants careful attention from market participants. The convergence of technical warnings, institutional outflows, and psychological pressure creates a challenging landscape for XRP price stability. While historical patterns provide valuable guidance, they represent probabilities rather than certainties, particularly given evolving market structures and regulatory environments.
Investors should balance technical concerns with fundamental developments, including Ripple’s business progress, network adoption metrics, and broader cryptocurrency sector trends. The $2.00 level represents a critical threshold for market psychology, with breaches potentially triggering significant technical reactions. Regardless of short-term price movements, disciplined risk management and long-term perspective remain essential for navigating cryptocurrency market volatility successfully.
FAQs
Q1: What specific pattern has Glassnode identified in XRP’s data?
Glassnode has detected a rare fractal pattern in XRP’s price and volume structure that closely resembles the configuration preceding the cryptocurrency’s 68% decline in early 2022. This pattern involves multiple technical elements including support level breaches, realized loss magnitudes, and investor cohort imbalances.
Q2: How significant are the recent XRP ETF outflows?
The $53.32 million in XRP ETF outflows recorded on January 21, 2025 represents the largest single-day withdrawal since these investment products launched. This suggests growing institutional caution and creates potential selling pressure as market makers adjust underlying holdings to meet redemption requests.
Q3: What price levels are analysts watching most closely?
The $2.00 threshold represents the primary technical and psychological level for XRP. Analysts identify the $1.10 to $1.03 range as a potential downside target if this support breaks, as this area aligns with the 200-week moving average that often provides support during bearish phases.
Q4: How does the current situation differ from 2022 conditions?
While technical patterns show similarities, regulatory clarity has improved significantly since 2022 due to Ripple’s partial legal victories. Market structure has also evolved with new institutional products, potentially influencing how technical patterns manifest in price action.
Q5: What should investors consider when evaluating these technical warnings?
Investors should balance technical patterns with fundamental developments, maintain appropriate position sizing, implement risk management strategies, and consider broader market context. Historical patterns provide guidance but don’t guarantee identical outcomes, particularly when market conditions show meaningful differences.