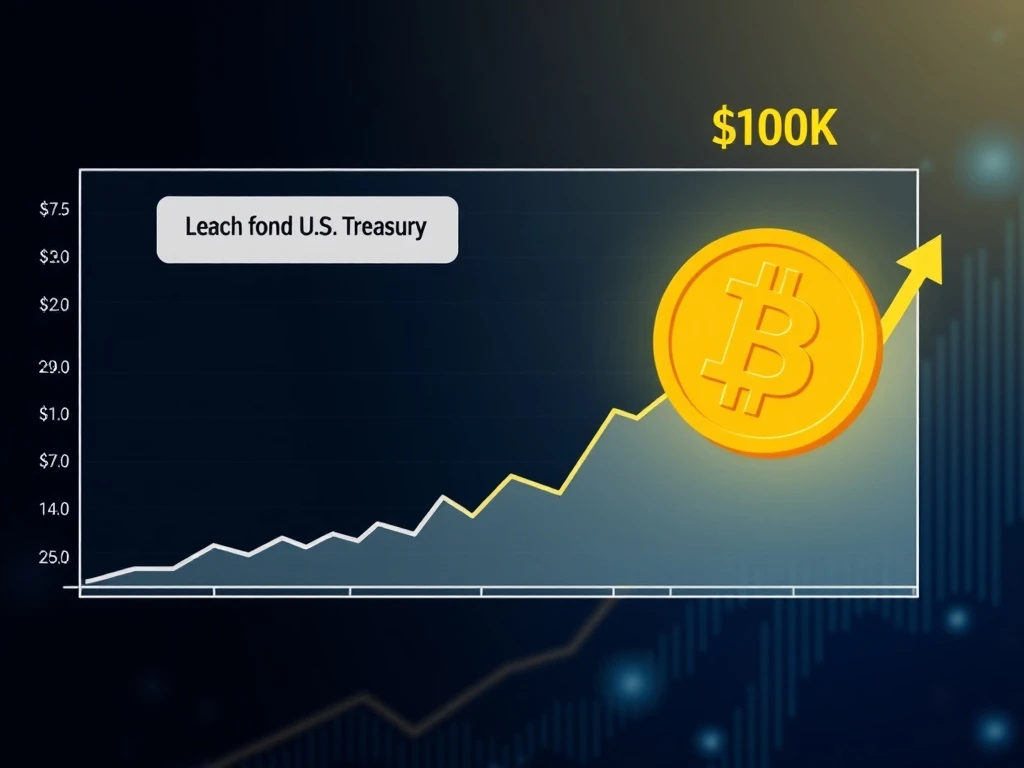
Bitcoin Price Prediction: Soaring to $100K as U.S. Treasury Volatility Craters to 4-Year Low
NEW YORK, April 2025 – A remarkable period of stability in the U.S. Treasury market, marked by volatility levels not seen since late 2021, is fueling a powerful and data-driven Bitcoin price prediction. Analysts now point to a concrete path for BTC to challenge the elusive $100,000 threshold. This analysis hinges on a fundamental macroeconomic relationship: as the bedrock of global finance calms, capital often seeks growth in higher-risk, higher-reward assets.
Bitcoin Price Prediction Tied to Treasury Market Calm
The core of this bullish Bitcoin price prediction rests on the behavior of the U.S. Treasury market. U.S. government bonds, traditionally seen as the ultimate safe-haven asset, have entered a phase of exceptional tranquility. Consequently, this stability has profound implications for global liquidity and investor psychology. When Treasury prices exhibit low volatility, financial institutions face lower hedging costs and greater certainty. This environment, in turn, facilitates easier credit creation and lending throughout the financial system.
An abundance of available capital typically encourages investors to move further out on the risk spectrum. Historically, this search for yield benefits asset classes like technology stocks and, more recently, cryptocurrencies. Therefore, the current calm in sovereign debt markets acts as a potential catalyst for a significant capital rotation. This rotation could directly support a sustained upward move in Bitcoin’s valuation.
Decoding the MOVE Index and Its Historical Correlation
To quantify this stability, market professionals monitor the ICE BofA MOVE Index (MOVE). This crucial metric tracks the expected volatility in U.S. Treasury bonds over the coming 30 days, derived from options pricing. Recently, the MOVE Index plummeted to 58. Notably, this level represents the lowest reading since October 2021. For context, the index spiked above 200 during the regional banking turmoil of 2023 and has averaged around 100 over the past decade.
The relationship between the MOVE Index and Bitcoin has demonstrated a persistent negative correlation. In simpler terms, when Treasury volatility falls, Bitcoin’s price has frequently risen, and vice-versa. This inverse relationship underscores Bitcoin’s evolving role as a potential hedge against traditional financial market stress and a beneficiary of market calm. Simultaneously, Bitcoin maintains a strong positive correlation with the Nasdaq 100 Index, a benchmark for technology and growth stocks. This dual correlation profile positions Bitcoin uniquely at the intersection of macro liquidity and technological adoption trends.
Expert Analysis on the Macroeconomic Shift
Financial strategists interpret this data within a broader macroeconomic framework. “The MOVE Index is a critical barometer of fear and complacency in the rates market,” explains a veteran market analyst from a major investment bank. “When it collapses to multi-year lows, it signals that the market perceives minimal near-term risk from Federal Reserve policy shifts or inflation surprises. This perception frees up risk budgets. Institutional allocators, seeing stable financing conditions, become more willing to increase exposure to volatile but high-growth assets like Bitcoin.”
This analysis is not mere speculation. Reviewing past cycles reveals instructive patterns. For instance, the prolonged period of low Treasury volatility in the mid-2010s coincided with a massive bull run in tech stocks. The current macroeconomic setup, featuring controlled inflation and a patient Federal Reserve, creates a similar backdrop. However, the digital asset ecosystem now offers a more mature and accessible venue for that risk-seeking capital compared to a decade ago.
The Mechanics of Credit Creation and Crypto Flows
Understanding this Bitcoin price prediction requires a look at the mechanics of modern finance. Stable Treasury yields directly impact the banking sector’s willingness to lend. Banks often use Treasuries as collateral for their own borrowing and lending activities. Low volatility means the value of this collateral is predictable, reducing balance sheet risk.
- Lower Hedging Costs: Financial entities spend less on insurance (via derivatives) against bond price swings.
- Increased Leverage Capacity: Predictable collateral values allow for greater and cheaper leverage in the system.
- Search for Yield: With safe assets offering modest returns, portfolio managers must allocate to riskier assets to meet return targets.
This process funnels liquidity toward markets with higher perceived growth. The cryptocurrency market, with its 24/7 trading and headline-grabbing potential, stands as a prime destination. Furthermore, the maturation of regulated financial products like Bitcoin ETFs has created a seamless conduit for this institutional capital to enter the crypto space without operational friction.
Historical Precedents and Market Psychology
Market history provides context for the current Bitcoin price prediction. The last time the MOVE Index hovered near these levels in late 2021, Bitcoin was approaching its previous all-time high near $69,000. While not a perfect predictor, this historical coincidence underscores the typical market regime. A low MOVE environment often aligns with a “risk-on” investor sentiment, which has historically been fertile ground for cryptocurrency appreciation.
The psychological impact on traders is equally significant. A stable macro backdrop reduces the fear of sudden, systemic shocks. This reduction in fear allows narratives around Bitcoin’s long-term value—such as its digital scarcity and potential as a store of value—to gain more traction. Investors feel more confident making longer-term bets rather than engaging in short-term speculation. This shift in time horizon can contribute to more sustainable price increases.
Risks and Counterpoints to the Bullish Outlook
A responsible analysis must also consider countervailing factors. Extended periods of low volatility often precede sharp market corrections when unexpected events occur. A sudden spike in inflation data or geopolitical tension could rapidly reverse the MOVE Index, potentially triggering a correlated sell-off across risk assets. Additionally, cryptocurrency markets remain influenced by internal factors like regulatory news, network activity, and technological developments, which can sometimes decouple them from macro trends.
Nevertheless, the current confluence of data presents a compelling case. The multi-year low in Treasury volatility acts as a strong tailwind. When combined with Bitcoin’s established supply schedule and growing institutional adoption, the fundamental setup for a price discovery phase toward $100,000 appears robust. Market technicians also note that a clean break above key resistance levels could accelerate momentum, drawing in trend-following capital.
Conclusion
The current Bitcoin price prediction pointing toward $100,000 is firmly rooted in observable macroeconomic data, specifically the cratering volatility of U.S. Treasuries. The MOVE Index’s plunge to a four-year low signals a market environment conducive to risk-taking and credit expansion. Historically, such conditions have correlated strongly with positive performance for Bitcoin. While external risks persist, the structural flow of capital from stable, low-yielding bonds toward growth-oriented digital assets provides a powerful fundamental narrative. As the Treasury market enjoys its calmest period in years, all eyes remain on whether Bitcoin can capitalize on this macro stability to achieve a historic and decisive breakthrough.
FAQs
Q1: What is the MOVE Index and why does it matter for Bitcoin?
The MOVE Index (Market Volatility Index) measures expected volatility in U.S. Treasury bond prices over the next 30 days. It matters for Bitcoin because a low MOVE Index indicates stability in traditional safe-haven assets, which often leads investors to seek higher returns in riskier markets like cryptocurrencies, creating a historical negative correlation.
Q2: How does low Treasury volatility lead to a higher Bitcoin price prediction?
Low Treasury volatility reduces uncertainty and hedging costs for financial institutions, facilitating easier credit creation and lending. This increase in system-wide liquidity often flows into risk assets as investors search for yield, potentially increasing demand and driving up the price of Bitcoin.
Q3: Has Bitcoin broken $100,000 before?
No, Bitcoin has never reached a price of $100,000. Its all-time high, as of this analysis, stands below $70,000. The prediction to surpass $100,000 would therefore represent a historic and unprecedented price level for the cryptocurrency.
Q4: What are the main risks that could invalidate this Bitcoin price prediction?
Key risks include a sudden surge in Treasury volatility due to unexpected inflation or geopolitical events, adverse cryptocurrency-specific regulation, a broader downturn in equity markets, or a failure of Bitcoin to maintain its technical and adoption momentum.
Q5: Does this analysis apply to other cryptocurrencies besides Bitcoin?
While the macro logic of capital flowing from stable bonds to risk assets benefits the broader crypto market, Bitcoin often acts as the primary beneficiary due to its high liquidity and status as a market benchmark. Altcoins may see amplified gains or losses depending on their individual fundamentals and correlation to Bitcoin’s price movements.