Binance Coin: Alarming Stagnation as BNB Price Stalls at $800 All-Time High
The cryptocurrency market is a dynamic beast, full of exhilarating surges and nerve-wracking pullbacks. Right now, all eyes are on Binance Coin (BNB), which finds itself at a pivotal crossroads. After a remarkable ascent, BNB has hit a ceiling near its all-time high of $800, but a glaring absence of strong trading volume is raising red flags across the board. Is this just a temporary pause, or are we on the brink of a significant crypto correction?
Binance Coin at a Critical Juncture: Why $800 Matters
Binance Coin, the native token of the world’s largest cryptocurrency exchange, has demonstrated impressive resilience. However, its recent push towards the $800 mark has been met with a formidable challenge. This isn’t just any arbitrary number; $800 represents BNB’s all-time high and the upper boundary of a long-term trading range it has been confined within for months. The inability to decisively close above this threshold, despite multiple attempts, indicates strong selling pressure or a lack of conviction from buyers.
Historically, resistance levels like this act as psychological and technical barriers. A true breakout typically requires overwhelming buying interest, which is best reflected in a surge of trading volume. Without it, the current price action looks more like a test than a confirmed breach, leaving many analysts concerned about the sustainability of the recent rally.
Understanding BNB Price Action: The Role of Weak Volume
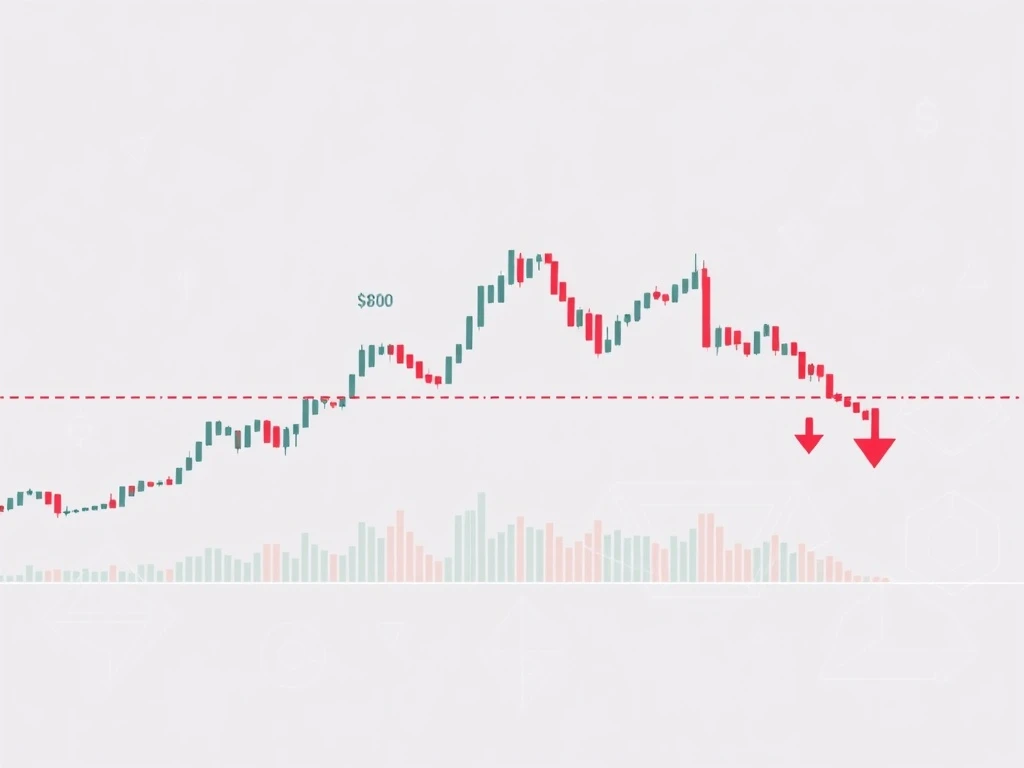
The saying goes, ‘volume confirms price.’ In the case of BNB price, the current situation paints a concerning picture. As the token approached $800, the accompanying volume remained subdued. This lack of participation during an upward move is a classic sign of market exhaustion – a scenario where the existing buyers are running out of steam, and new capital isn’t flowing in strongly enough to sustain the momentum.
Technical indicators further underscore this apprehension. Weekly charts for BNB have started to form what’s known as a ‘selling wick.’ This candlestick pattern, characterized by a long upper shadow, often signals rejection at a strong resistance level. It suggests that while the price did briefly touch higher levels, sellers quickly pushed it back down, indicating strong overhead supply. If BNB fails to secure a robust weekly close above $800 with significant volume, it could confirm that the current breakout attempt is indeed insufficient, paving the way for a downward rotation.
Navigating a Potential Crypto Correction: Key Support Levels to Watch
Should Binance Coin fail to maintain its current levels, attention will quickly shift to critical support zones. These are the price points where historical buying interest has emerged, potentially offering a bounce or consolidation:
- $600: This level is particularly significant as it aligns with the midpoint of BNB’s multi-month trading range (between $400 and $800). Furthermore, it corresponds to the ‘point of control’ from volume profile analysis, indicating it’s where the most trading activity has occurred. This makes it a crucial short-term stability zone.
- $540: Below $600, the $540 mark represents the ‘value area low’ within the volume profile. This is another key area where strong buying interest might emerge to prevent a deeper fall.
- $400: This is the lower boundary of BNB’s long-term consolidation range. A breakdown below $540 could trigger a full-range rotation back towards this level, reinforcing the broader sideways structure that has defined BNB’s higher-timeframe behavior.
The ability of these support levels to hold will dictate BNB’s immediate future. If they can absorb selling pressure, BNB might consolidate and prepare for another attempt at $800. However, a decisive break below $540 would be a strong bearish signal, opening the door for a return to the range’s lower limits.
Is Market Exhaustion Setting In? What Traders Need to Know
The current state of Binance Coin is a textbook example of how a lack of confirming trading volume can signal underlying weakness, even after reaching impressive highs. The threat of market exhaustion is real, and traders are keenly watching for definitive signals.
For a true breakout above $800 to be validated, we need to see a decisive weekly close accompanied by a significant spike in buying volume. Without this confirmation, the higher probability path remains a corrective move towards $600 or even lower. Traders and investors are advised to monitor the $600 level closely. Its integrity will be a key determinant of whether BNB can establish a higher low and resume its upward trajectory, or if it will remain trapped within its multi-month range, potentially facing a deeper crypto correction.
In conclusion, while Binance Coin has reached an impressive milestone, the journey ahead is fraught with uncertainty. The absence of robust volume at its all-time high suggests caution is warranted. The coming days will be crucial in determining whether BNB can defy the odds and break free, or if it’s destined for a significant pullback to retest lower support levels. Keep a close eye on those volume bars!
Frequently Asked Questions (FAQs)
Q1: What does it mean when Binance Coin (BNB) stalls at an all-time high?
When BNB stalls at an all-time high, it means the price has reached its previous peak but is struggling to break above it. This often indicates strong resistance from sellers or a lack of sufficient buying pressure to push the price higher, signaling a potential pause or reversal.
Q2: Why is weak trading volume a concern for BNB’s rally?
Weak trading volume during an upward price move suggests that the rally is not being supported by broad market participation. This can indicate ‘market exhaustion,’ meaning fewer new buyers are entering, and the existing momentum might be unsustainable. It increases the likelihood of a price correction as the rally lacks conviction.
Q3: What are the key support levels for BNB if a crypto correction occurs?
Key support levels for BNB, as highlighted by analysts, include $600 and $540. The $600 level is significant as the midpoint of its long-term range and a point of control from volume profile. The $540 level represents the value area low. A breakdown below these could lead to a deeper correction towards $400.
Q4: What is a ‘selling wick’ on a weekly chart?
A ‘selling wick’ (or upper shadow) on a candlestick chart indicates that during the period (in this case, a week), the price reached a high point but was pushed down significantly before the close. A long selling wick at a resistance level often signals rejection and strong selling pressure, suggesting that buyers failed to maintain higher prices.
Q5: What needs to happen for BNB to confirm a breakout above $800?
For BNB to confirm a decisive breakout above $800, it needs a strong weekly close above this level, crucially accompanied by a significant surge in trading volume. This combination would indicate robust buying interest and market conviction, validating the upward move and suggesting the start of a new uptrend.


