XRP Price Plunge: Will $3.00 Support Hold Amid $18B Liquidations?
The world of cryptocurrency is rarely dull, and for XRP holders, the past few days have been a rollercoaster. Recent movements in the **XRP price** have captured significant attention, as the digital asset grapples with a pivotal moment. A sharp 11% drop has put its crucial $3.00 support level to the test, sparking intense debate among investors and analysts alike about its immediate future. What’s driving this volatility, and can XRP bounce back from this latest challenge?
Understanding the Recent **XRP Price** Drop
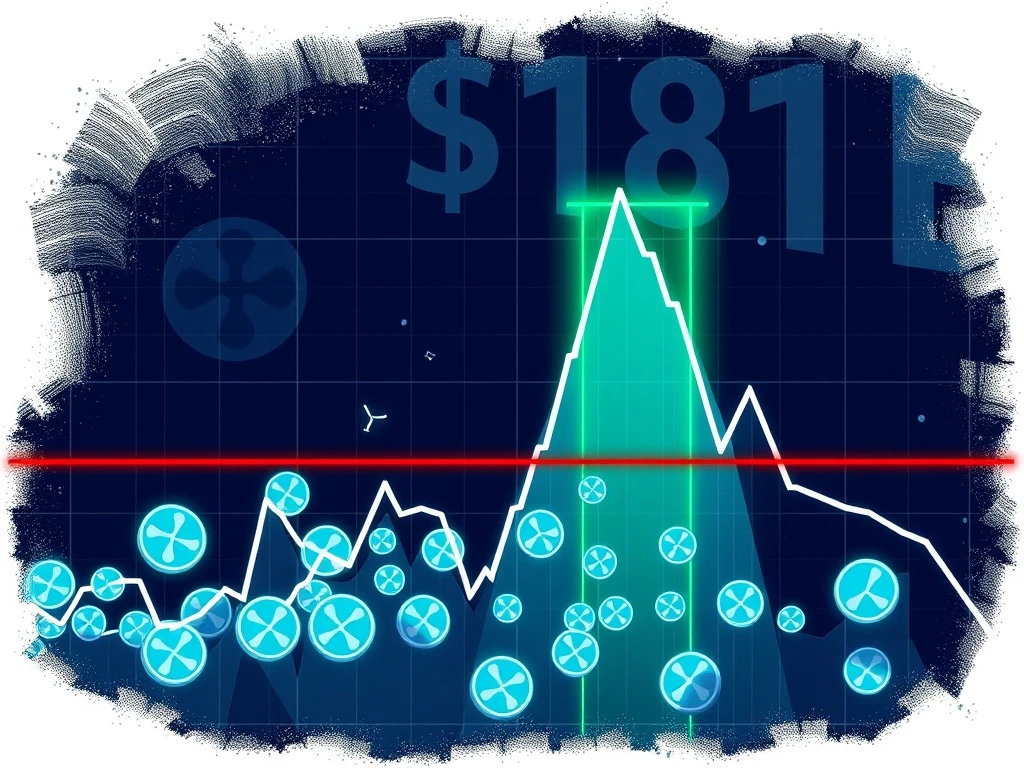
XRP’s recent dip is more than just a minor fluctuation; it’s a significant event tied to broader market forces. The cryptocurrency experienced an 11% fall, pushing it back towards the critical $3.00 mark. This decline is largely attributed to massive liquidations across the crypto market, reportedly exceeding $18 billion. Such large-scale liquidations often trigger widespread sell-offs, impacting even strong assets like XRP.
- The Pullback: After a notable surge from $1.95 to $3.65 in 30 days, a 16% correction followed.
- Market Impact: The $18 billion in liquidations created a consolidation phase for many cryptocurrencies, including XRP.
- Analyst Perspective: According to technical analyst XRPunkie, this sharp pullback is a ‘healthy correction,’ a normal part of the crypto market cycle where buyers step in at key support zones.
Is the **XRP Support** at $3.00 Strong Enough?
The $3.00 level isn’t just a random number; it’s a psychological and technical threshold for XRP. After briefly dipping to this mark, XRP managed to reclaim the $3.09 zone, signaling a fight from the bulls. However, the true test of its resilience lies in its ability to sustain this level.
Technical indicators offer a mixed bag of signals:
- Hourly Charts: Show a downward-sloping trend line, suggesting immediate bearish pressure.
- Moving Averages: The 100-hour moving average at $2.98 acts as a secondary support. A sustained close below $3.00 could open doors to further declines towards $2.80–$2.60.
- Fibonacci Levels: Key thresholds are identified at $3.05 (38.2% retracement) and $2.849 (50% retracement). Holding above these levels is crucial for bullish momentum.
The battle for $3.00 is a defining moment. If buyers continue to step in and volume increases, it could signal a trend reversal or even a new breakout attempt. Conversely, a decisive break below this level would validate bearish scenarios.
**XRP Technical Analysis**: Bearish Signals vs. Bullish Hopes
When diving into **XRP technical analysis**, we see a fascinating tug-of-war between bearish indicators and underlying bullish patterns. While short-term metrics suggest caution, longer-term views offer a glimmer of hope.
Bearish Signals:
- MACD & RSI: Both the Moving Average Convergence Divergence (MACD) and Relative Strength Index (RSI) on hourly charts signal bearish momentum. The 24-hour RSI reading at 83.08 indicates overbought conditions, hinting at potential correction risks.
- Resistance Levels: Breaking above the current resistance level of $3.350 is essential for any significant upward movement.
Bullish Hopes:
- Weekly Chart Bullish Flag: Analyst Ali Martinez highlights a breakout from a bullish flag pattern on the weekly chart. This pattern often precedes significant upward movements, potentially pushing XRP towards its all-time high of $15, aligning with the measured flagpole projection.
- Long-term Moving Averages: The 50-day and 200-day moving averages at $2.43 and $1.82, respectively, provide a solid baseline for long-term bullish sentiment.
The interplay between these short-term pressures and long-term potential makes XRP’s current position particularly intriguing for traders.
Navigating **Crypto Liquidations** and Broader Market Trends
The recent **crypto liquidations** are not isolated to XRP. The broader cryptocurrency market has been experiencing heightened volatility, largely influenced by Bitcoin’s movements and significant events like the ETF freeze. These macro trends create ripple effects across altcoins, including XRP.
While XRP saw a commendable 20% gain over seven days, the 0.8% drop in the past 24 hours reflects the ongoing struggle between buyers and sellers. This dynamic is a direct consequence of the market’s overall sentiment, which is currently cautious due to the liquidation events and regulatory uncertainties surrounding ETFs.
Investors are urged to monitor not just XRP’s individual performance but also the broader market’s health, as interconnectedness means that major shifts in Bitcoin or other large-cap cryptos will inevitably impact XRP.
What’s Next for **XRP News**? Key Levels to Watch
The coming weeks will be critical for XRP. All eyes will be on liquidity shifts and institutional activity, as these factors often dictate the next major move. For those following **XRP news** closely, here are the key levels and scenarios to monitor:
- Bullish Scenario: A sustained rebound above $3.350 could attract a fresh wave of buyers, potentially reigniting a rally towards $3.60–$4.00. Some models even suggest a long-term potential push towards $10–$15 if this momentum holds.
- Bearish Scenario: Binance analysts caution that a failure to hold $3.60 might drive XRP to $2.80 or even lower. A breakdown below $3.00 would significantly erode confidence and confirm bearish trends.
Traders should pay close attention to divergences in price and momentum indicators. These often foreshadow upcoming directional moves, providing crucial insights for making informed decisions.
In conclusion, XRP is at a crossroads. Its defense of the $3.00 support level is more than just a technical battle; it’s a defining moment that could either serve as a launchpad for significant gains or a warning sign for deeper declines. The interplay of technical indicators, broader market trends, and investor sentiment will determine XRP’s trajectory in the short to medium term. As always, vigilance and a clear understanding of market dynamics are paramount for navigating these volatile waters.
Frequently Asked Questions (FAQs)
Q1: Why did XRP’s price fall by 11% recently?
XRP’s recent 11% price fall is primarily attributed to a broader market event involving massive cryptocurrency liquidations exceeding $18 billion. This created a widespread sell-off pressure, impacting many digital assets, including XRP, which was also undergoing a natural correction after a significant price surge.
Q2: What is the significance of the $3.00 support level for XRP?
The $3.00 level is a critical psychological and technical support for XRP. Holding above this level suggests resilience and potential for recovery or further gains. A sustained close below $3.00, however, could signal a breakdown and potential further declines to lower support levels like $2.80 or $2.60.
Q3: Are there any bullish signs for XRP despite the recent drop?
Yes, despite short-term bearish signals from indicators like MACD and RSI, the weekly chart for XRP shows a breakout from a bullish flag pattern. This pattern is often a precursor to significant upward movements, with some analysts suggesting it could lead to a rally towards XRP’s all-time high of $15, aligning with measured flagpole projections.
Q4: How do broader crypto trends like Bitcoin’s volatility and ETF freeze affect XRP?
XRP’s price action is highly interconnected with the broader crypto market. Bitcoin’s volatility and events like the ETF freeze create ripple effects across altcoins. When Bitcoin experiences significant price swings or there are major market-wide uncertainties (like an ETF freeze), it often leads to increased caution, sell-offs, and liquidations across the entire crypto ecosystem, directly influencing XRP’s performance.
Q5: What are the key resistance levels XRP needs to break for a rally?
For XRP to reignite a significant rally, it needs to break and sustain above the $3.350 resistance level. A successful breakout above this point could pave the way for a move towards $3.60-$4.00, and potentially even higher targets as suggested by some long-term models.


