XRP Price Prediction: Crucial 20-Day EMA Retest Signals Potential Surge
The world of cryptocurrency is always buzzing with activity, and right now, all eyes are on XRP. The digital asset, closely associated with Ripple, finds itself at a pivotal moment, retesting a crucial technical indicator that could dictate its short-term future. If you’re invested in XRP or simply tracking the broader crypto market, understanding this development is key to anticipating its next move.
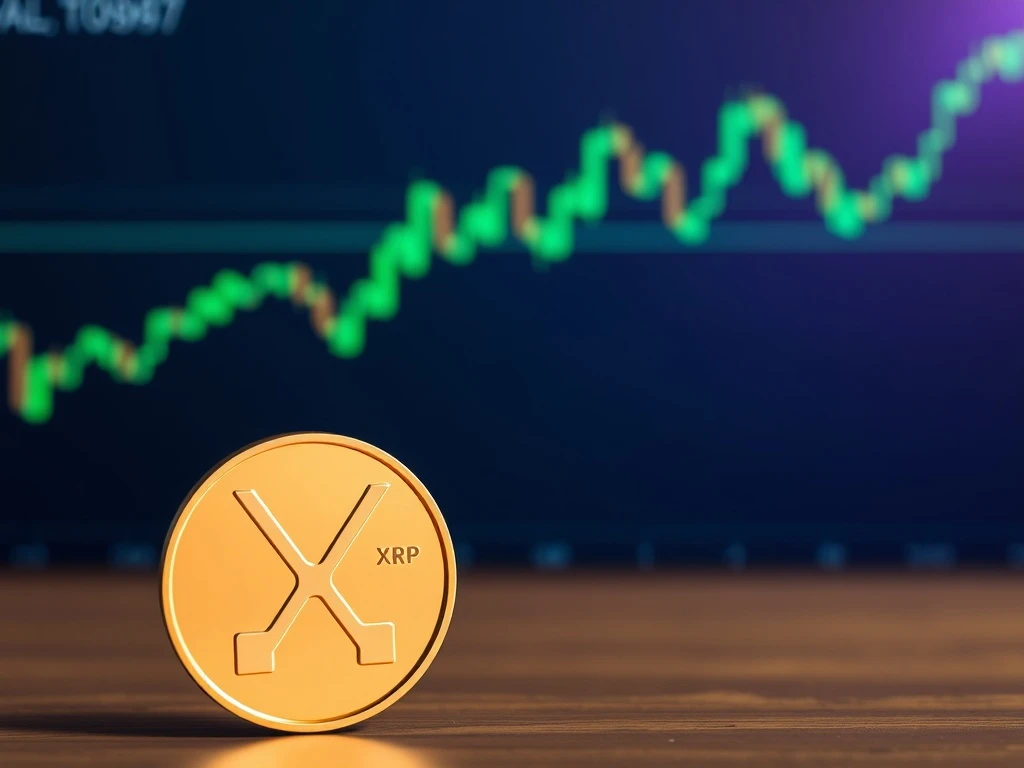
XRP Price at a Critical Juncture: The 20-Day EMA Retest
After an impressive rally and a significant breakout from a key triangle pattern, XRP price has returned to test its 20-day Exponential Moving Average (EMA) for the first time. This isn’t just a minor blip on the chart; it’s a highly anticipated event that traders and analysts are watching closely. The 20-day EMA is a widely respected technical indicator that helps identify the average price of an asset over the past 20 trading days, giving more weight to recent prices. For XRP, this retest is happening in a crucial zone, with reports placing it anywhere between $2.09 and $3.01, depending on the data source.
Why is this retest so important? Think of the 20-day EMA as a dynamic support level. When an asset breaks above it and then comes back down to touch it, a successful bounce can confirm the strength of the previous breakout and signal continued bullish momentum. For late entrants into the market, this retest can present a potential entry point with a favorable risk-reward setup. However, there’s a flip side: if XRP dips *below* this level, it could signal weakness, invalidating the bullish narrative and potentially triggering a shift in market sentiment. Traders are emphasizing that holding above this EMA is absolutely essential for the bulls to maintain control and prevent short-term selling pressure from pushing XRP into a consolidation phase.
Unpacking XRP’s Technical Analysis: What Do the Indicators Say?
Delving deeper into the technical analysis, the current outlook for XRP is a mix of encouraging signals and lingering uncertainties. Let’s break down what some of the most popular indicators are telling us:
- Moving Average Convergence Divergence (MACD): This momentum indicator, along with rising trading volume, suggests sustained buying pressure. Following XRP’s notable 4% gain after breaking out of a symmetrical triangle pattern, the MACD has been hinting at underlying strength, indicating that buyers are still active in the market.
- 50-Day Moving Average: While the 20-day EMA is the immediate focus, the 50-day moving average remains a critical fallback. Should the 20-day EMA fail to hold, the 50-day MA would likely become the next significant support zone. This provides a crucial safety net for bulls, but a test of this level would indicate increased selling pressure.
- LuxAlgo Trendline Analysis: This advanced analysis tool further underscores that XRP is in a “post-breakout retest” phase. This means the market isn’t simply continuing its upward trajectory unchecked; instead, it’s taking a moment to assess the sustainability of the recent upward move. It’s a period of validation where the market determines if the previous rally has strong foundations.
- The “Golden Cross” Conundrum: A “golden cross” occurs when a shorter-term moving average (like the 50-day MA) crosses above a longer-term moving average (like the 200-day MA). This is widely considered a strong bullish signal, often preceding significant upward trends. While an unconfirmed golden cross for XRP adds a layer of complexity and potential bullishness, its confirmation is still pending, leaving the exact path forward dependent on how price action unfolds at these key levels. Conversely, a “death cross” (50-day MA dipping below 200-day MA) would be a strong bearish signal, which analysts are closely monitoring to ensure the bullish case isn’t invalidated.
Navigating the XRP Market: Key Levels and Price Prediction
Market psychology plays a profound role in how XRP price prediction unfolds. Traders aren’t just looking at lines on a chart; they’re reacting to sentiment, fear, and greed. Here are the key price levels to watch and what they might signify:
- Sustained Move Above $3.25: This level has previously acted as a resistance point for XRP. A decisive break and sustained move above $3.25 could trigger a retest of $3.66, aligning with historical resistance levels. This would be a significant bullish development, potentially opening the door for new multi-year highs.
- Critical Support at $2.99: A drop below $2.99 would signal a shift in short-term momentum. If this level breaks, the 50-day MA would become the next critical threshold for support. Failure to hold the 20-day EMA, especially if the 50-day MA also falters and potentially dips below the 200-day MA, could invalidate the current bullish case.
- Consolidation Near $3.4: XRP’s recent consolidation near $3.4, after peaking at $3.65, reflects a delicate balance. Some view this pullback as a healthy, temporary pause before the next leg up, suggesting the rally is not over. Others caution it could be a “bull trap,” where a brief rally attracts new buyers only to retreat, potentially trapping those who entered late.
The 20-day EMA isn’t just a technical line; it’s a psychological linchpin. Its outcome will largely shape the next phase of XRP’s trajectory. Traders are advised to monitor volume closely. A strong bounce with increasing volume would be a powerful bullish confirmation, while a break below with high volume would signal significant weakness.
Beyond the Charts: Broader Crypto Market Influences on XRP News
While XRP news and its technical setup are paramount, it’s crucial to remember that XRP doesn’t exist in a vacuum. The broader crypto market context significantly influences individual asset performance. Currently, improved macroeconomic conditions and surging trading volumes across the cryptocurrency space provide a supportive backdrop. This general market optimism can help bolster XRP’s price, even during periods of retesting.
However, despite the favorable macro environment, XRP’s performance remains intrinsically tied to its specific technical setup. The outcome of this current 20-day EMA retest is likely to dictate near-term expectations more than any other single factor. Traders and investors should maintain a vigilant watch on both the micro (XRP’s charts) and macro (overall market) indicators. Decisive action above or below the 20-day EMA, especially accompanied by significant volume changes, will be the ultimate determinant of whether the rally continues its impressive run or enters a more prolonged consolidation phase.
In conclusion, XRP stands at a crossroads. The retest of the 20-day EMA is a high-stakes moment, offering both immense opportunity for bullish continuation and the risk of a short-term pullback. By closely monitoring key technical indicators, understanding critical price levels, and staying aware of broader market sentiment, investors can better navigate XRP’s volatile yet exciting journey. The coming days will be telling, as the market decides if this digital asset will surge to new heights or take a breather before its next big move.
Frequently Asked Questions (FAQs)
1. What is the 20-day EMA and why is it important for XRP’s price?
The 20-day Exponential Moving Average (EMA) is a technical indicator that tracks the average price of XRP over the past 20 trading days, giving more weight to recent prices. It’s crucial because it often acts as a dynamic support or resistance level. For XRP, retesting the 20-day EMA after a breakout helps confirm if the upward trend is sustainable. A successful bounce indicates continued bullish momentum, while a break below could signal weakness.
2. What does a “triangle breakout” mean in cryptocurrency trading?
A triangle breakout occurs when an asset’s price moves decisively out of a symmetrical, ascending, or descending triangle pattern on a chart. These patterns represent periods of consolidation where price action narrows. A breakout, especially on high volume, suggests a strong directional move is likely to follow, often in the direction of the breakout (upward in XRP’s recent case).
3. What are the key price levels to watch for XRP’s future movement?
Traders are closely watching several key price levels for XRP. A sustained move above $3.25 could lead to a retest of $3.66. On the downside, a drop below $2.99 would be a concern, with the 50-day Moving Average becoming the next critical support. Failure to hold these levels could indicate a shift in momentum or a deeper correction.
4. What is a “golden cross” and how does it affect XRP’s outlook?
A “golden cross” is a bullish technical signal that occurs when a shorter-term moving average (e.g., 50-day MA) crosses above a longer-term moving average (e.g., 200-day MA). It suggests a potential long-term uptrend is forming. For XRP, an unconfirmed golden cross adds a layer of potential bullishness, but its full impact on the XRP price prediction depends on whether it’s definitively confirmed by continued positive price action.
5. How do broader crypto market conditions influence XRP news and price?
While XRP’s technical setup is key, the overall crypto market significantly impacts its performance. Positive macroeconomic conditions, increased investor sentiment, and surging trading volumes across the entire cryptocurrency space can provide a supportive environment for XRP. Conversely, a general market downturn can exert downward pressure on XRP, even if its individual technicals look strong. Therefore, monitoring both specific XRP news and the broader market context is vital.


