XRP Price: Alarming Onchain Data Reveals Why $3 is Out of Reach

For investors closely watching the market, the current state of **XRP price** is a major point of discussion. Despite hopes for significant upward movement, reaching the $3 mark appears challenging in the near term. Let’s dive into the data and technical indicators explaining this.
What Does **XRP Onchain Data** Tell Us?
Network activity provides crucial insights into user engagement and demand. Unfortunately, recent **XRP onchain data** suggests a slowdown:
- New daily addresses on the XRP Ledger have seen a sharp decline, falling significantly from a peak of over 15,000 in January to around 3,500 recently.
- Daily active addresses also dropped dramatically from a recent high of 577,000 to roughly 34,000.
Historically, this type of decreased activity often precedes periods of price stagnation or even drops, as it signals reduced interest and lower transaction volume.
Why is **XRP Open Interest** Decreasing?
Another key indicator is open interest (OI), which represents the total number of outstanding derivative contracts. A decrease in OI suggests traders are closing positions, often anticipating a price drop.
- **XRP open interest** has fallen by 30% in the past month, from $5.53 billion to $3.89 billion.
- This mirrors previous instances where significant OI drops preceded price declines, such as the 53% drop seen earlier this year.
This reduction in leveraged positions indicates a weakening bullish sentiment among traders, adding pressure to the **XRP price**.
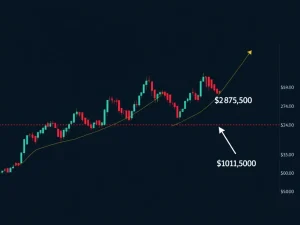
**XRP Technical Analysis** Points to Downside Risk
Beyond onchain metrics, the charts themselves present a challenging picture for the **XRP price**. **XRP technical analysis** shows the altcoin is struggling below key resistance levels defined by major moving averages, sitting between $2.22 and $2.40. Sustained trading below these lines often leads to prolonged consolidation or further declines.
Prominent analysts note the difficulty XRP faces at the $2.25 level. Failure to break this resistance increases the probability of testing lower support zones, potentially revisiting $2.01, $1.90, or even $1.55.
Furthermore, a descending triangle pattern on the weekly chart suggests a potential target around $1.20 if the critical $2.00 support level is breached. The Relative Strength Index (RSI) has also cooled significantly from overbought levels, indicating increasing bearish momentum.
What Does This Mean for **XRP Market Analysis**?
Combining the insights from **XRP market analysis** – the declining onchain activity, decreasing open interest, and bearish technical patterns – paints a picture of an asset facing significant headwinds. While a long-term consolidation could theoretically precede a large upward move, similar to 2017, the immediate data suggests that breaking above current resistance and reaching targets like $3 remains a distant prospect for now.
It’s important to remember that cryptocurrency markets are volatile, and unexpected developments can always shift sentiment. However, based on the current data points, the path of least resistance for XRP appears to be sideways consolidation or further downside before a significant upward trend can be established.
This article does not contain investment advice or recommendations. Every investment and trading move involves risk, and readers should conduct their own research when making a decision.