XRP Price: Epic Breakout Predicted After 200 Days Consolidation
For nearly 200 days, the XRP price has been trading within a relatively tight range, leaving many traders and investors wondering what comes next. This extended period of XRP consolidation has created a fascinating technical setup, with analysts pointing to historical patterns for potential clues about future movements.
Understanding the Current XRP Price Action
Since a significant surge in late 2024, the XRP price has largely remained locked between $1.90 and $2.90. This sideways movement, spanning almost 200 days, indicates a battle between buyers and sellers, with neither side currently dominating the market. This indecision is clearly visible on the daily charts, where attempts to break out of this range have repeatedly failed.
What Does Historical XRP Analysis Suggest?
Several analysts are looking to the past for insights into where the XRP price might be headed. One prominent piece of XRP analysis involves comparing the current pattern to historical fractals, particularly from 2017.
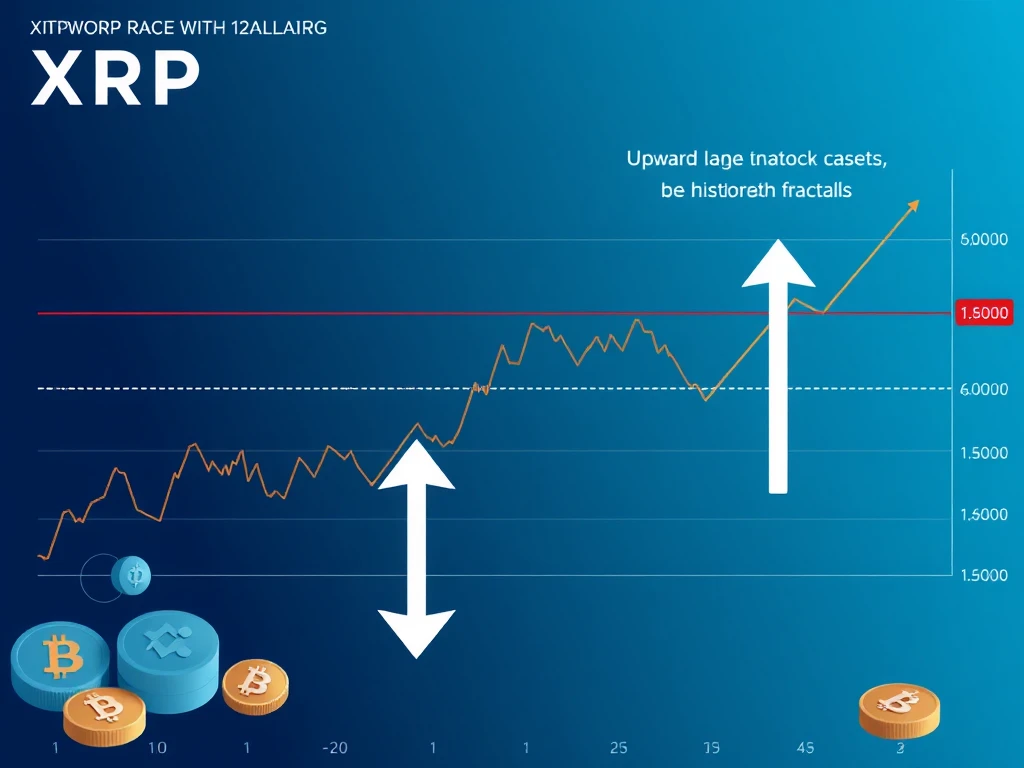
- 2017 Fractal Similarity: Analyst Mikybull Crypto highlighted similarities between the current three-week chart and the structure seen before XRP’s large rally in 2017. This previous setup, involving a symmetrical triangle, preceded a significant price increase.
- Symmetrical Triangle Pattern: The current consolidation phase appears to include a symmetrical triangle. While this pattern is typically neutral, analyst XRPunkie suggests it could resolve with an ‘epic breakout’. Based on the 2017 fractal, a breakout from the triangle’s apex could target around $3.70, representing potential gains of 75% from current levels.
Long-Term XRP Consolidation: Setting the Stage for Massive Gains?
Beyond the shorter-term patterns, a deeper dive into XRP analysis reveals an even longer period of consolidation. Analyst GalaxyBTC points to a multi-year fractal on the weekly chart, comparing the current setup to the 2014–2017 period.
- The 2014-2017 consolidation lasted over 1,200 days and led to a substantial 1,300% rally.
- The current consolidation has extended for over 2,470 days, nearly seven years.
If XRP were to mirror the 1,300% rally from its recent breakout zone near $0.63, this long-term perspective suggests a potential peak between $8 and $10. Some even more ambitious XRP price prediction models, incorporating Fibonacci targets and potential ETF developments, project targets as high as $25 or even $27.
Is There a Bearish Outlook for the XRP Price?
While many analysts lean bullish, a different perspective emerges from another piece of XRP analysis. The multi-month price action could be forming an inverse cup-and-handle pattern, which is a bearish reversal structure. This pattern suggests a potential move lower.
- The pattern shows XRP peaking near $2.90 and then rounding off.
- If confirmed, this bearish setup projects a potential decline towards the $1.33 level.
- This target aligns with a key Fibonacci retracement level that acted as resistance during the 2021 correction.
What Does This Mean for Crypto Market Analysis?
This case study in crypto market analysis highlights the importance of considering multiple technical patterns and timeframes. The extended XRP consolidation phase has created a high-stakes scenario where a break in either direction could lead to a significant price move. While historical fractals offer compelling bullish arguments and ambitious XRP price prediction targets, the potential for a bearish outcome based on alternative patterns cannot be ignored. As always, conducting personal research and understanding the inherent risks is crucial in the volatile cryptocurrency market.
This article does not contain investment advice or recommendations. Every investment and trading move involves risk, and readers should conduct their own research when making a decision.