XRP Plunge: Unpacking the Critical Market Downturn for Ripple

The cryptocurrency market is a whirlwind of rapid shifts, and recently, all eyes have been on Ripple (XRP). If you’ve been tracking its movements, you’ve likely noticed a significant downturn. This comprehensive market overview delves into the technical indicators and price action that shaped XRP’s recent performance, offering crucial insights for traders and investors navigating these volatile waters.
Decoding XRP’s Recent Plunge: A Technical Deep Dive
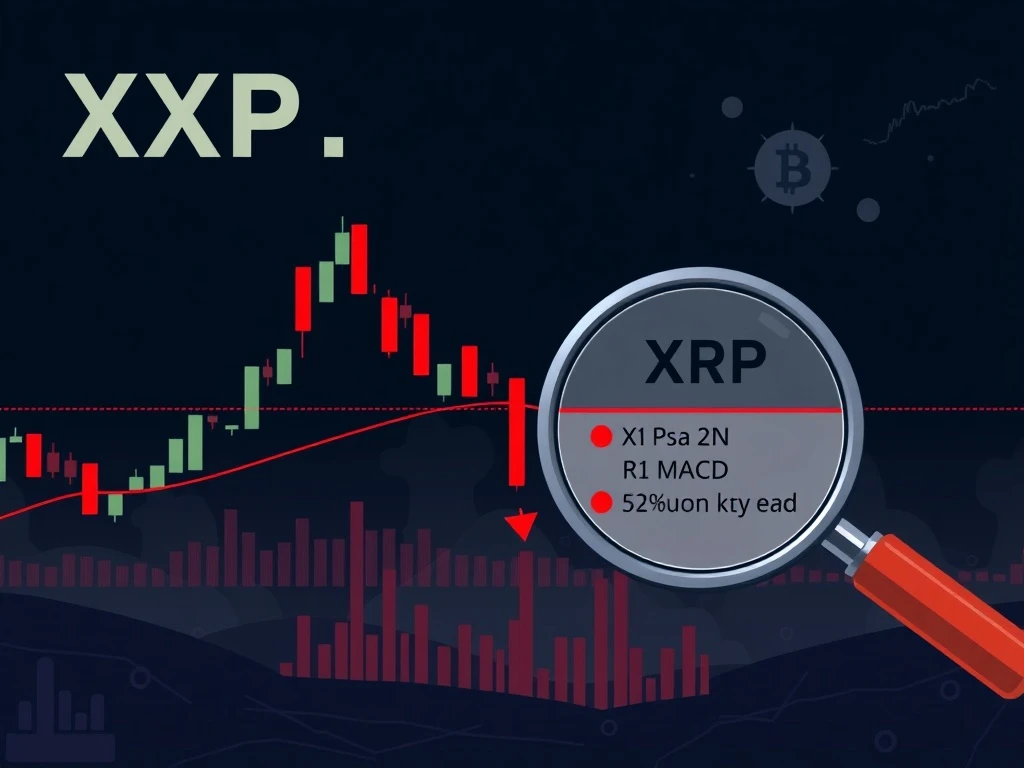
Ripple’s native token, XRP, has experienced a challenging period, marked by a notable decline in its value against USDT. From a peak of 3.2603, XRPUSDT sharply retreated to 3.0058, decisively breaking through a crucial psychological support level at 3.10 and subsequently testing the 3.00 mark. This downward momentum was strongly confirmed by the formation of a bearish engulfing pattern between 3.12 and 3.00 during a key trading session, signaling a definitive shift in market sentiment towards the bears.
The daily trading session for XRPUSDT on July 24-25, 2025, painted a clear picture of this bearish pressure:
- Opening Price: 3.2191 ET
- High: 3.2603 ET
- Low: 3.0000 ET
- Closing Price: 3.0380 ET
- Total Volume: 49,195,085.82 XRP
- Total Turnover: 155.48 million USD
The formation of a doji candle near the 3.0058 level suggests a moment of indecision among traders after the sharp drop, hinting at potential short-term consolidation before the next major move.
Key Indicators Signaling Caution: What Do They Tell Us About Ripple?
Technical indicators provide a deeper understanding of market dynamics, and for Ripple, several key metrics are flashing red, indicating a prolonged bearish bias. Understanding these can be vital for any crypto trading strategy.
Moving Averages: A Bearish Alignment
On the 15-minute chart, XRPUSDT’s closing price consistently remained below its 20-Simple Moving Average (SMA) and 50-SMA. This short-term alignment reinforces the immediate bearish momentum. Zooming out to the daily chart, the situation appears even more entrenched: XRP is trading significantly below its 50-day, 100-day, and 200-day moving averages. This broad alignment of price below long-term moving averages is a classic indicator of a strong, prolonged downtrend, suggesting that the current bearish pressure is not merely a fleeting event but part of a larger market structure.
MACD & RSI: Seeking a Reversal Signal?
- MACD (Moving Average Convergence Divergence): The MACD line has crossed below the signal line and turned negative, a clear sign of continued bearish momentum. This indicator suggests that the selling pressure is persistent and that buying interest remains subdued.
- RSI (Relative Strength Index): In contrast to the MACD, the RSI dropped into oversold territory, nearing 30 during the final hours of the session. An oversold RSI often suggests that an asset has been sold too aggressively and might be due for a short-term bounce or a period of consolidation. However, without a strong bullish catalyst or significant volume surge, a sustained reversal from oversold conditions is unlikely. It merely flags the potential for a temporary reprieve rather than a full trend change.
Bollinger Bands: Volatility Expands
Volatility for XRP expanded significantly, as evidenced by the widening of the Bollinger Bands from 3.15 to 3.26 during the early morning hours. The price closing near the lower band at 3.0380 is a common setup that can precede a potential bounce, as prices tend to revert to the mean. However, given the overarching bearish pressure, this bounce might be limited and the price could remain constrained within the lower part of the bands, indicating continued downward bias.
Volume Dynamics and Fibonacci Levels: Unlocking XRP Trading Insights
Beyond price charts, understanding the underlying volume and key Fibonacci levels can provide actionable insights for XRP trading strategies.
Volume & Turnover: A Divergence to Watch
During the critical breakdown below the 3.10 support level, volume surged, indicating strong conviction from sellers. However, a crucial divergence emerged in the final 4-6 hours of the session: despite a sharp drop in price, trading volume declined. This divergence suggests that the bearish conviction might be waning, and the intensity of selling pressure is diminishing. While the price is still falling, the reduced volume could signal a potential near-term consolidation phase or even a pause in the aggressive downtrend.
Fibonacci Retracements: Identifying Key Resistance
For traders employing technical analysis, Fibonacci retracement levels are invaluable for identifying potential support and resistance zones. The 61.8% retracement level of the recent bullish swing (from 3.00 to 3.26) is precisely at 3.11. This level now acts as a significant resistance point for XRP. A retest and successful close above this 3.11 level could trigger a partial rebound, offering a glimmer of hope for bulls. Conversely, a failure to hold or break above this resistance would likely extend the downtrend, potentially pushing XRP back towards 3.00 or even lower to 2.95.
Navigating the Volatile Waters: Strategic Market Analysis for XRP Investors
Given the confluence of bearish signals and waning selling volume, what should XRP investors anticipate in the immediate future? A prudent market analysis suggests a cautious approach.
XRPUSDT may find temporary support around the 3.03–3.05 range, offering a brief respite from the relentless selling pressure. From here, a test of the 3.11 Fibonacci resistance level is plausible within the next 24 hours. However, the critical factor for any potential reversal or sustained rebound will be XRP’s ability to close above the 3.13 level. A failure to achieve this would reinforce the bearish momentum, likely pushing the price further down towards 3.00, with 2.95 becoming the next significant target for bears.
Investors are advised to remain highly cautious. The market remains dominated by bearish sentiment, and any short-term bounces should be viewed with skepticism unless accompanied by significant buying volume and a decisive break above key resistance levels. Monitoring the 3.13 level will be paramount as a potential reversal signal; a clear breakout above it could indicate a shift in the immediate trend, but until then, downside risks persist.
What’s Next for XRP Price?
The immediate future for XRP price appears challenging, with a strong bearish bias dominating the charts. While technical indicators like RSI suggest an oversold condition that could trigger a short-term bounce, the broader market structure, confirmed by moving averages and MACD, points to continued downside pressure. The critical levels to watch are the 3.00 psychological support and the 3.11-3.13 resistance zone. A sustained move above 3.13 is essential for any meaningful recovery, otherwise, further declines towards 2.95 are on the horizon. Vigilance and a clear understanding of these technical thresholds will be key for navigating XRP’s journey in the coming days.
Frequently Asked Questions (FAQs)
1. What is a bearish engulfing pattern and why is it important for XRP?
A bearish engulfing pattern is a two-candlestick formation where a large red (bearish) candle completely ‘engulfs’ the previous small green (bullish) candle. It’s important because it signals a strong reversal of momentum from bullish to bearish, indicating that sellers have taken control and are pushing prices down significantly. For XRP, its formation at a key resistance level confirmed downward pressure.
2. What does it mean when XRP’s RSI hits oversold territory?
When the Relative Strength Index (RSI) falls below 30, it indicates that the asset is oversold, meaning it has been sold off very aggressively and might be due for a short-term price correction or bounce. While it suggests potential for a bounce, it doesn’t guarantee a full trend reversal, especially in a strong downtrend. It simply flags that selling pressure might be temporarily exhausted.
3. Why are moving averages important in analyzing XRP’s price?
Moving averages smooth out price data to identify trend direction. When XRP’s price trades consistently below its short-term (e.g., 20-SMA, 50-SMA) and long-term (e.g., 50-day, 200-day) moving averages, it confirms a strong bearish trend. They act as dynamic resistance levels, and a price breaking above them can signal a potential trend reversal or strengthening of bullish momentum.
4. What is the significance of the 61.8% Fibonacci retracement level for XRP?
The 61.8% Fibonacci retracement level is considered a key technical level. It represents a common point where a price correction or bounce might reverse direction. For XRP, the 3.11 level acting as the 61.8% retracement of a recent bullish swing means it’s a significant resistance. A failure to break above it suggests the previous bullish move has been largely negated, and the downtrend is likely to continue.
5. Is XRP likely to recover soon after this market overview?
Based on the current technical market overview, a sustained recovery for XRP in the immediate term appears unlikely without a strong bullish catalyst. While a short-term bounce from oversold RSI levels is possible, the overall trend remains strongly bearish, with key moving averages and MACD confirming the downside. Investors should look for a decisive break and close above 3.13 to signal a potential shift in momentum.
6. What key levels should XRP investors watch for in the coming days?
XRP investors should closely monitor the temporary support zone around 3.03-3.05. More critically, watch the 3.11 Fibonacci resistance level and, most importantly, the 3.13 price point. A clear breakout and close above 3.13 would be a strong bullish signal, while a failure to do so could lead to further declines towards 3.00 and potentially 2.95.


