XRP Price: Golden Cross Signals Potential 158% Surge, Igniting Hope for Crypto Investors
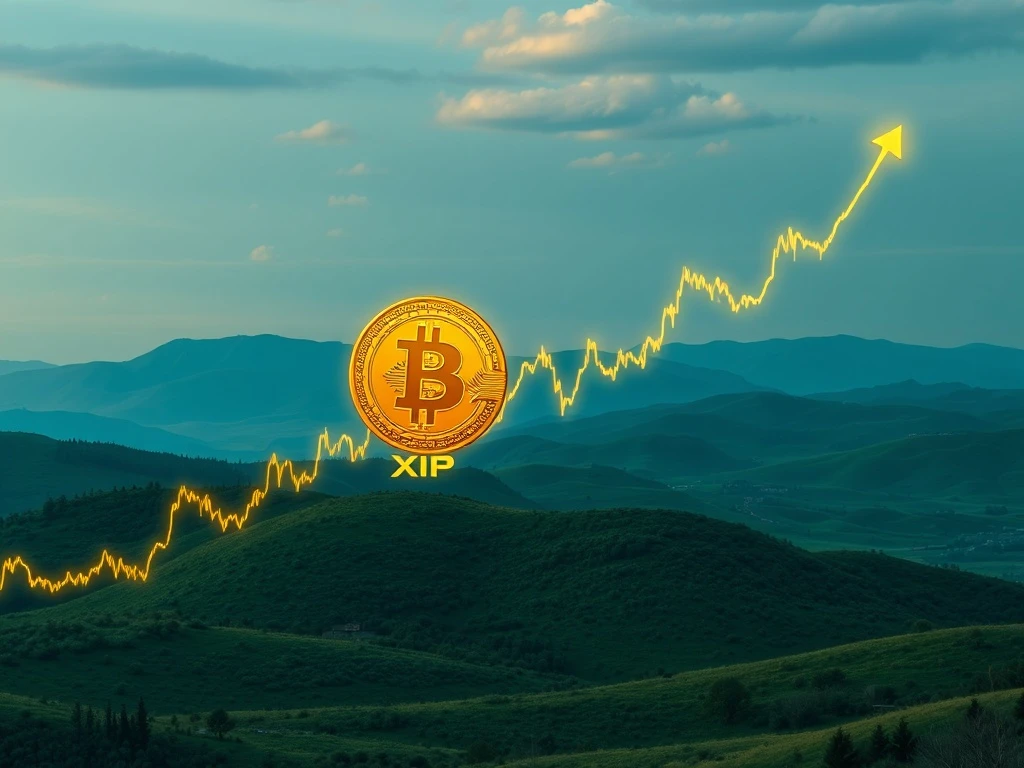
The cryptocurrency world is abuzz with exciting news for XRP enthusiasts. A rare and highly anticipated technical pattern has emerged on the XRP/BTC trading pair: a ‘golden cross.’ This significant event, where the 23-day moving average crosses above the 200-day moving average, has historically preceded substantial price movements. For **XRP price**, this particular golden cross is drawing significant attention because it mirrors conditions that led to a remarkable 158.66% surge against Bitcoin in a two-week period last year. Could history be about to repeat itself, offering a compelling opportunity for **crypto investors**?
Understanding the Golden Cross: A Beacon for XRP Price Movement
For those new to technical analysis, a golden cross is a chart pattern that indicates a long-term bullish trend. It occurs when a short-term moving average (like the 23-day MA) crosses above a long-term moving average (like the 200-day MA). This crossover is often interpreted by traders as a strong buy signal, suggesting that momentum is shifting from bearish to bullish, and a significant upward movement may be on the horizon.
In the context of **XRP price**, the formation of this golden cross on the XRP/BTC chart is particularly potent. Why? Because it signifies a strengthening of XRP’s position relative to Bitcoin, the dominant cryptocurrency. When XRP gains strength against BTC, it often translates into significant gains in its USD value, especially if Bitcoin itself is stable or trending upwards. This pattern suggests that XRP is not just moving with the broader market, but is carving out its own bullish narrative.
The Anatomy of the Current XRP Golden Cross: What the Chart Reveals
The recent **XRP golden cross** is not just a theoretical concept; it’s a tangible event on the charts with specific markers that align with previous breakout conditions. Here’s a closer look at the technical details:
- Moving Average Crossover: The primary signal is the 23-day MA decisively crossing above the 200-day MA. This isn’t a fleeting event but a confirmed shift in long-term momentum.
- Reclaiming Key Averages: Beyond the golden cross, XRP has also reclaimed crucial support levels, specifically the 50-day and 200-day moving averages. This indicates robust buying pressure and a successful defense of critical price floors.
- Consolidation Range: Price action has been consolidating within a tight range, specifically between 0.00002480 and 0.00002684. This narrow range is significant because it was observed immediately before the last major upswing, suggesting accumulation before a breakout.
- Strong Support at 200-day MA: The formation of a long-wick candle at the 200-day moving average highlights strong buying interest at this level. A long wick at the bottom of a candle indicates that sellers tried to push the price down, but buyers stepped in forcefully to push it back up, signaling strong support.
These technical indicators, collectively, paint a picture of an asset gearing up for a significant move. The fact that this golden cross has occurred on long-term timeframes makes it even more impactful, as such phenomena are uncommon in XRP/BTC trading history.
Drawing Parallels: The 158.66% Surge Revisited and XRP Prediction
What makes this current golden cross so compelling is its striking resemblance to a prior event that led to a monumental 158.66% surge for XRP against Bitcoin last year. During that period, similar technical setups were observed:
- Identical MA Crossover: The exact same moving average configuration preceded the previous rally.
- Pre-Rally Consolidation: A period of price consolidation, much like the current one, was observed before the explosive move. This allows for accumulation by larger players before a breakout.
- Renewed Buying Pressure: Just as we see now, there was a clear resurgence of buying interest, pushing XRP above key resistance levels.
The previous surge wasn’t a random occurrence; it was the result of these technical patterns playing out in a favorable market environment. While historical performance is never a guarantee of future results, the re-emergence of such a reliable pattern provides a strong basis for an optimistic **XRP prediction**. It suggests that the underlying market dynamics and investor psychology that drove the previous rally might be at play once again.
Beyond the Charts: Market Dynamics and the Bitcoin Price Factor
The broader market context also plays a crucial role in XRP’s potential performance. Currently, **Bitcoin price** has entered a phase of consolidation. While this might seem uneventful, it often creates an ideal environment for altcoins to shine. When Bitcoin’s volatility is low and it trades sideways, investor focus tends to shift towards assets with robust technical setups and promising narratives.
This ‘altcoin season’ dynamic is well-known in the crypto space. As Bitcoin takes a breather, capital often flows into alternative cryptocurrencies, seeking higher returns. XRP, with its established presence, growing utility, and now a compelling technical signal, stands to benefit significantly from this shift in investor attention. The low volatility in BTC provides the perfect backdrop for altcoins like XRP to make independent, substantial moves.
Navigating the Opportunity: What Should Crypto Investors Watch For?
For **crypto investors** looking to capitalize on this potential opportunity, monitoring key indicators will be crucial. The primary trigger for a confirmed rally would be a decisive break above current resistance levels, accompanied by a significant increase in trading volume. Increased volume validates price movements, indicating strong institutional and retail interest.
Here are some actionable insights:
- Monitor Resistance Breakouts: Watch the upper boundary of the consolidation range (around 0.00002684 BTC). A clear break above this level, especially on higher timeframes, would be a strong confirmation signal.
- Volume Confirmation: Look for a notable surge in trading volume concurrent with any price breakout. A breakout without significant volume might be a false signal.
- Risk Management: While the technical setup is compelling, all investments carry risk. Consider setting stop-loss orders to protect capital in case the market moves unexpectedly.
- Broader Market Sentiment: Keep an eye on overall crypto market sentiment and any major news events that could impact Bitcoin or altcoins.
The convergence of strong technical signals, historical precedent, and favorable market conditions creates a high-probability opportunity for XRP. While past performance does not guarantee future results, the alignment of these factors suggests that XRP is uniquely positioned for potential outperformance in the near term.
The Road Ahead: What Could Challenge This XRP Prediction?
While the technical signals are overwhelmingly bullish, it’s prudent for **crypto investors** to consider potential headwinds that could impact this optimistic **XRP prediction**. Regulatory developments, particularly ongoing legal battles involving Ripple (the company behind XRP), could introduce volatility. Macroeconomic factors, such as unexpected shifts in global interest rates or a broader market downturn, could also dampen enthusiasm across the entire crypto market, including XRP. Furthermore, an unexpected surge or sharp decline in **Bitcoin price** could alter the dynamics of the XRP/BTC pair, potentially diverting attention or capital. Staying informed about these broader influences is essential for a comprehensive investment strategy.
Conclusion: A Golden Opportunity for XRP?
The formation of a rare golden cross on the XRP/BTC chart is undoubtedly one of the most exciting developments in the crypto market today. This technical phenomenon, coupled with XRP reclaiming key moving averages and stabilizing near critical support levels, paints a compelling picture of renewed bullish momentum. The striking parallels to last year’s 158.66% surge against Bitcoin add a layer of historical validation to this potential breakout. As Bitcoin consolidates, altcoins like XRP are gaining traction, and this golden cross could be the catalyst for significant gains. While caution and diligent monitoring are always advised, the current environment appears highly conducive to altcoin outperformance, making XRP a cryptocurrency to watch closely for those seeking substantial returns.
Frequently Asked Questions (FAQs)
What is a golden cross in cryptocurrency trading?
A golden cross is a bullish technical pattern where a short-term moving average (e.g., 23-day) crosses above a long-term moving average (e.g., 200-day). It indicates a potential long-term upward trend and is often seen as a strong buy signal for **XRP price** and other cryptocurrencies.
How reliable is the golden cross for predicting XRP price surges?
While no technical indicator guarantees future results, the golden cross is considered a historically reliable bullish signal. In XRP’s case, it previously preceded a significant 158.66% surge against Bitcoin, making its current appearance particularly noteworthy for an **XRP prediction**.
Why is the XRP/BTC pair important for XRP’s overall value?
The XRP/BTC pair indicates XRP’s strength relative to Bitcoin, the market leader. When XRP gains against BTC, it often translates to substantial gains in XRP’s fiat value (e.g., USD), especially if **Bitcoin price** is stable or rising. It suggests XRP is outperforming the broader market.
What should crypto investors do if they see a golden cross on XRP/BTC?
**Crypto investors** should monitor the chart for confirmation, such as a decisive break above resistance levels accompanied by high trading volume. It’s also crucial to practice risk management, such as setting stop-loss orders, and stay informed about broader market conditions.
Are there any risks associated with this XRP prediction?
Yes, all investments carry risks. While the golden cross is a strong signal, factors like unexpected regulatory changes, macroeconomic downturns, or sudden shifts in **Bitcoin price** could impact XRP’s performance. Historical performance does not guarantee future results.


