WBTCUSDT: Unlocking Wrapped Bitcoin’s Explosive Market Surge and Future Potential

Are you keeping an eye on the crypto markets? If so, you’ve likely noticed the remarkable performance of Wrapped Bitcoin (WBTCUSDT) recently. This isn’t just another coin; it’s Bitcoin’s power brought to the Ethereum blockchain, offering unparalleled flexibility. The latest market movements for WBTCUSDT have caught the attention of traders and investors alike, signaling a potentially significant shift in its trajectory. Let’s dive deep into what’s driving this momentum and what the charts are telling us about its future.
Understanding the WBTCUSDT Surge: What’s Driving the Momentum?
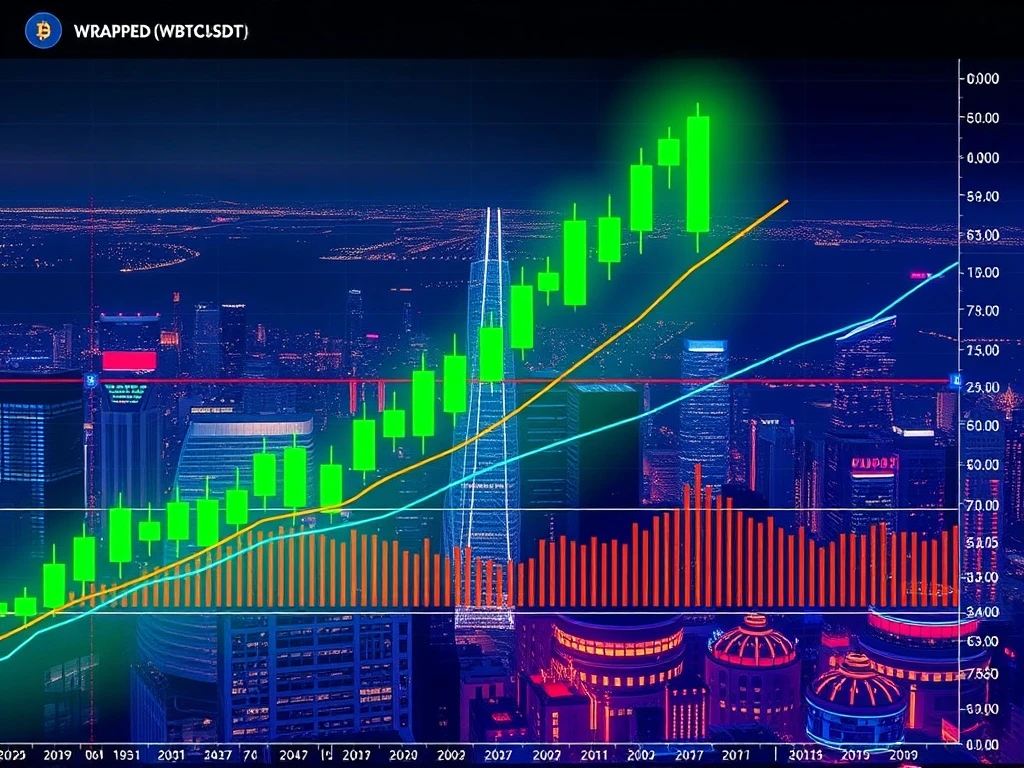
The past trading session for WBTCUSDT was nothing short of impressive. Wrapped Bitcoin surged significantly, breaking above the $117,000 mark on robust volume. This kind of upward movement, especially when accompanied by strong trading activity, often indicates genuine bullish sentiment. The pair opened at $115,226.44 and closed at a healthy $117,725.66, reaching a 24-hour high of $118,142.92. With a total volume of 29.33 BTC and a notional turnover of $3,457,000, the market clearly showed its conviction.
From a structural perspective, the 15-minute chart painted a clear picture of a strong bullish trend. We observed a consistent series of higher highs and higher lows, forming a well-defined ascending channel. This pattern is typically a positive sign for continuation. Key support levels have now solidified around $116,600 and $116,000, while resistance points are emerging at $118,100 and potentially $118,500. A bullish engulfing pattern near $117,500 further reinforced the idea that buyers are in control.
Decoding Key Technical Indicators for Wrapped Bitcoin
To truly understand the market, we need to look beyond just price action. Technical indicators provide crucial insights into momentum, volatility, and potential turning points. Here’s what they revealed for WBTCUSDT:
Moving Averages: Reinforcing the Bullish Bias
- On the 15-minute timeframe, the price consistently closed above both the 20-period and 50-period moving averages. This alignment is a classic bullish signal, suggesting that the short-term trend remains firmly to the upside.
- Zooming out to the daily chart, WBTCUSDT is trading above its 50 and 100-period moving averages. However, it’s now approaching the 200-period MA. This longer-term average can often act as a significant psychological and technical barrier. Traders should watch this level closely, as a breakthrough could signal a stronger long-term uptrend, while a rejection might lead to a period of consolidation.
Momentum Check: MACD and RSI — Is a Pullback Imminent?
Momentum indicators are vital for gauging the strength and speed of price movements. For WBTCUSDT, these indicators presented a mixed but insightful picture:
- The Moving Average Convergence Divergence (MACD) crossed above its signal line mid-session. This confirmed the bullish momentum, indicating that buying pressure was indeed increasing.
- However, the Relative Strength Index (RSI) surged into overbought territory late in the session, reaching 75. An RSI above 70 typically suggests that an asset is overbought and might be due for a short-term correction or consolidation. This divergence between continued price strength and an overextended RSI hints at potential pullback risk. For those looking to enter or add to their long positions, a pullback that retests the 60 level on the RSI, especially if confirmed by the MACD, could present a strategic re-entry opportunity.
Bollinger Bands: Signaling Heightened Volatility and Potential Consolidation
Bollinger Bands are excellent for understanding volatility and potential price extremes. During the recent rally, volatility expanded significantly, with the price touching the upper band at $118,142.92. The widening of these bands suggests increased market participation and the potential for further upside movement. However, this expansion also increases the likelihood of a retest of the middle or lower band. A retest of the lower band, currently around $116,600, could signal a consolidation phase before the next directional move.
Volume & Turnover: Confirming the Bitcoin Price Trend
Volume is often called the ‘fuel’ of any price movement. A strong price move on high volume is generally considered more reliable. For Bitcoin price, specifically its wrapped version, WBTCUSDT:
- Volume spiked dramatically during the rally above $117,000. The largest 15-minute bar recorded an impressive 1.495 BTC in volume.
- Notional turnover also increased in direct correlation with the price move, further confirming the strength and conviction behind the bullish trend.
It’s crucial to watch for any divergence between volume and price in the upcoming sessions. If the price continues to climb but volume starts to dwindle, it could indicate weakening momentum and a potential reversal.
Fibonacci Retracements: Pinpointing Key Support Levels for WBTCUSDT
Fibonacci retracement levels are powerful tools for identifying potential support and resistance zones based on previous price movements. For the recent 15-minute rally from $116,000 to $118,142.92, key Fibonacci levels emerged:
- The 38.2% retracement level is around $117,200.
- The 61.8% retracement level is approximately $116,600.
The price has already retested the 38.2% level. A move below the 61.8% level at $116,600 could trigger a deeper correction. On the daily chart, the 61.8% retracement of the broader $115k–$118k move sits at $116,500, marking a critical short-term support area to monitor.
Actionable Insights for Crypto Traders: Navigating the WBTCUSDT Landscape
So, what does all this mean for you as a trader or investor? WBTCUSDT clearly has momentum on its side, but the overbought conditions indicated by the RSI suggest caution is warranted. Here are some actionable insights:
- Watch for Pullbacks: A short-term correction is plausible. Keep an eye on the $117,200 (Fibonacci 38.2%) and $116,600 (Fibonacci 61.8% and lower Bollinger Band) levels as potential support zones. These could offer attractive re-entry points for long positions if confirmed by other indicators.
- Confirm with Volume: Always confirm price movements with volume. A rally on declining volume is less sustainable than one on increasing volume.
- Monitor MACD and RSI: Look for the RSI to cool down from overbought territory (e.g., retesting 60) and for the MACD to maintain its bullish cross.
- Psychological Barriers: Be aware of the 200-period Moving Average on the daily chart as a potential resistance.
Conclusion: Balancing Enthusiasm with Caution in Crypto Market Analysis
The recent performance of WBTCUSDT has been impressive, showcasing strong bullish momentum driven by significant volume and favorable chart patterns. However, as with any asset experiencing rapid gains, a degree of caution is necessary. Overbought conditions, particularly on the RSI, suggest that a healthy pullback could be on the horizon. Savvy traders will use this potential correction as an opportunity to re-evaluate positions or enter at more favorable levels. As always, the crypto market is known for its high volatility, and sudden reversals are always a possibility. Stay informed, use your technical tools, and trade wisely!
Frequently Asked Questions (FAQs)
Q1: What is Wrapped Bitcoin (WBTC)?
A1: Wrapped Bitcoin (WBTC) is an ERC-20 token backed 1:1 by Bitcoin. It allows Bitcoin holders to participate in the Ethereum decentralized finance (DeFi) ecosystem, enabling them to use their BTC in dApps, for lending, borrowing, and more, without having to sell their Bitcoin.
Q2: What do overbought conditions on the RSI mean for WBTCUSDT?
A2: When the Relative Strength Index (RSI) reaches overbought territory (typically above 70), it suggests that the asset’s price has risen too quickly and may be due for a short-term correction or consolidation. For WBTCUSDT reaching 75, it implies that while momentum is strong, a pullback could be imminent.
Q3: Why is volume important when analyzing WBTCUSDT’s price movements?
A3: Volume confirms the strength of a price move. A significant price increase on high volume indicates strong conviction from buyers and is generally more sustainable. Conversely, a price increase on low volume might suggest a lack of broad market support and could be more prone to reversal.
Q4: What are key support levels to watch for WBTCUSDT?
A4: Based on recent price action and Fibonacci retracements, key support levels for WBTCUSDT are around $117,200 (38.2% Fibonacci) and $116,600 (61.8% Fibonacci and potential lower Bollinger Band retest). These levels could act as potential bounce points if a pullback occurs.
Q5: How does the 200-period Moving Average affect WBTCUSDT?
A5: The 200-period Moving Average on a daily chart is a significant long-term indicator. It often acts as a strong psychological and technical barrier. If WBTCUSDT approaches this level, it could face resistance, potentially leading to a consolidation or a temporary reversal before attempting a breakthrough.


