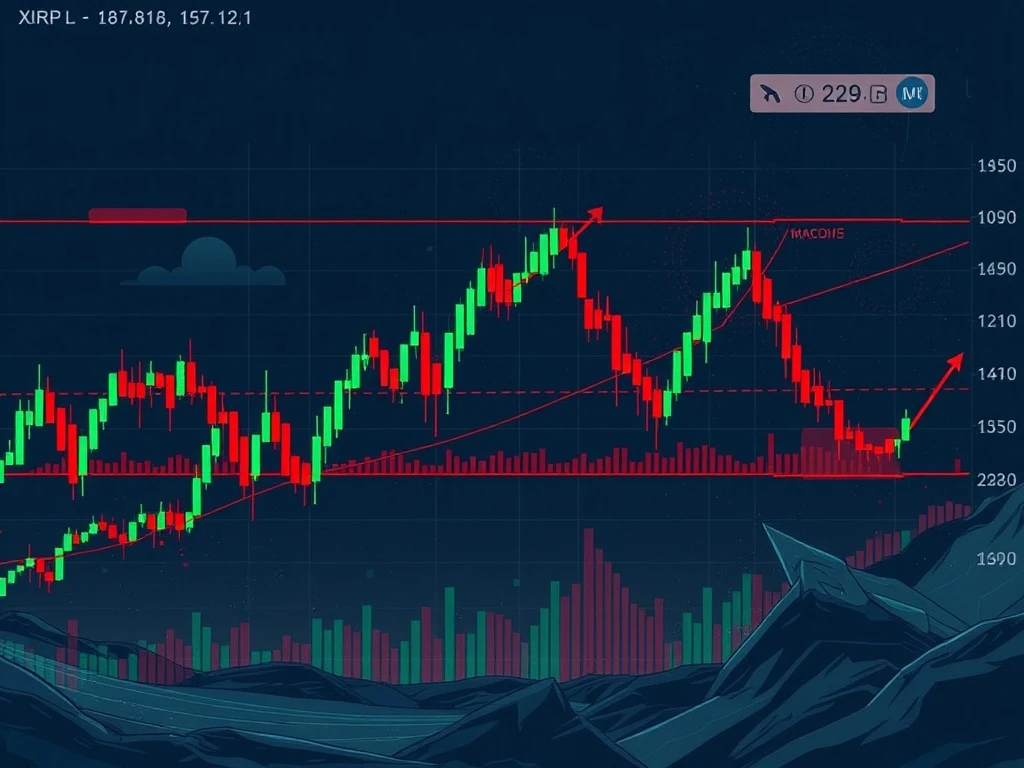
Urgent XRP Price Alert: Deep Dive into Ripple’s Volatile 24-Hour Performance

The cryptocurrency market is a dynamic beast, and the past 24 hours have certainly tested the resilience of Ripple (XRP) holders. A dramatic selloff has sent XRP’s price tumbling, leaving many investors wondering: what exactly triggered this sharp decline, and more importantly, what does the XRP price analysis tell us about its immediate future? Let’s dive into the technical details and chart a potential course for XRPUSDT.
Decoding Ripple’s Dramatic Price Plunge: A Closer Look at XRP Price Action
In the last 24 hours, Ripple (XRPUSDT) experienced a significant downturn. Opening at $3.2191, it briefly touched a high of $3.2603 before a brutal overnight selloff pushed it to a low of $3.0447, ultimately closing at $3.0745. This sharp decline underscores a shift in market sentiment, moving from bullish optimism to palpable bearish pressure. The 24-hour trading volume surged to approximately 73,046,810.1 units, with a notional turnover of $234,541,483. This spike in volume during the selloff is a critical indicator, confirming strong bearish conviction and suggesting that sellers were aggressively pushing the price down.
A key observation on the 15-minute chart was the formation of a bearish engulfing pattern between $3.1776 and $3.1447. This powerful candlestick formation often signals a strong reversal, indicating that sellers have overwhelmed buyers. While a crucial support zone between $3.12 and $3.14 held briefly, the sustained bearish momentum eventually broke through, paving the way for further declines. A doji candle near $3.1259 initially hinted at indecision, but it was quickly followed by a decisive breakdown. Looking ahead, immediate resistance levels are identified at $3.15–$3.16 and $3.20–$3.22, which will be crucial hurdles for any potential rebound.
Unpacking Key Technical Indicators for XRP: What the Charts Reveal
Understanding the underlying technical indicators is paramount for any meaningful XRP technical analysis. Here’s what the various tools are signaling:
- Moving Averages: On the 15-minute chart, XRP closed below both the 20-period and 50-period moving averages, signaling immediate short-term bearish momentum. More significantly, the daily chart shows XRPUSDT closing below all major moving averages (50, 100, 200). This reinforces a broader bearish bias across different timeframes. A retest of the 50-day MA, currently around $3.18, will be a critical test for the asset; failing to reclaim this level could solidify the downtrend.
- MACD & RSI: The Moving Average Convergence Divergence (MACD) indicator crossed below its signal line early in the selloff, providing clear confirmation of accelerating bearish momentum. Meanwhile, the Relative Strength Index (RSI) plunged into oversold territory (below 30) during the early morning hours. An oversold RSI often suggests that an asset may be due for a short-term bounce as selling pressure temporarily exhausts. However, for a confirmed reversal, a strong close above $3.18 would be needed to indicate a genuine shift in sentiment.
- Bollinger Bands: Volatility expanded dramatically as XRP’s price broke below the lower Bollinger Band, reaching as low as $3.0447. The widening of these bands reflects heightened uncertainty and aggressive selling pressure. Currently, the price is trading well below the 20-period moving average within the lower band, indicating that bearish pressure is likely to persist unless a sharp and sustained reversal takes hold.
What Do Fibonacci Retracements Tell Us About Ripple (XRPUSDT)?
Fibonacci retracement levels are powerful tools for identifying potential support and resistance zones based on prior price movements. Applying Fibonacci to the 15-minute swing from $3.1776 to $3.0447, we find key levels:
- The 61.8% retracement level is at $3.107.
- The 78.6% retracement level is at $3.136.
- The 50% level at $3.111 was briefly tested but failed to hold, reinforcing bearish control.
On the daily chart, Fibonacci levels from the recent high of $3.26 to the low of $3.04 suggest key retracements at $3.15 and $3.19. These levels could act as significant hurdles for any upward movement or as potential areas for consolidation if the price manages to stabilize.
Navigating the Future: Your XRP Price Prediction & Strategy in a Volatile Crypto Market
Given the current technical landscape, the immediate outlook for XRPUSDT suggests a potential test of the $3.10–$3.12 range in the next 24 hours. The oversold RSI hints at the possibility of a near-term bounce, which could offer a temporary reprieve. However, it’s crucial to understand that this bounce might be short-lived if it lacks significant buying volume and fails to reclaim key resistance levels.
A break below $3.10 would be a significant bearish signal, potentially accelerating the decline further and opening the door to lower price targets. Investors and traders should maintain a cautious approach, closely monitoring volume and price action around the identified Fibonacci and moving average levels. A sustained rebound would require strong bullish confirmation, ideally with a convincing close above $3.18, accompanied by increasing buying volume. Until then, the prevailing sentiment in the crypto market outlook for XRP remains bearish, and vigilance is key to navigating these volatile waters. For an accurate XRP price prediction, continuous monitoring of these key indicators is essential.
The past 24 hours have highlighted the inherent volatility of the cryptocurrency market, with Ripple (XRP) bearing the brunt of a significant selloff. While technical indicators like the oversold RSI offer a glimmer of hope for a short-term bounce, the broader picture remains bearish, reinforced by broken support levels and critical moving averages. Investors must remain agile, focusing on key resistance levels and volume trends to gauge whether XRP can find its footing or if further declines are on the horizon. As always, informed decision-making based on thorough analysis is your best defense in such dynamic market conditions.
Frequently Asked Questions (FAQs)
1. What caused the recent XRP price drop?
The article highlights a sharp selloff in the overnight session, confirmed by a large 15-minute bearish engulfing pattern and a significant spike in trading volume, indicating strong bearish conviction. While specific news triggers aren’t mentioned, the technical indicators confirm aggressive selling pressure.
2. What do technical indicators suggest for XRP’s short-term future?
Technical indicators show short-term bearish momentum (price below 20/50-period MAs), confirmed by MACD crossing below its signal line. However, the RSI is in oversold territory (below 30), suggesting a potential for a near-term bounce. A strong close above $3.18 is needed to confirm a reversal.
3. Is XRP likely to recover soon?
While the oversold RSI suggests a potential for a short-term bounce, a sustained recovery is not yet confirmed. XRP needs to reclaim key resistance levels, particularly the 50-day moving average around $3.18, with strong buying volume to signal a true reversal of the bearish trend.
4. What are the key resistance levels for XRP to watch?
Key resistance levels identified include $3.15–$3.16 and $3.20–$3.22. Fibonacci retracement levels from the recent high also point to $3.15 and $3.19 as significant hurdles for any upward movement.
5. How does trading volume impact XRP’s price movements?
Trading volume is crucial for confirming price movements. The article notes that volume spiked significantly during the selloff, which confirmed the bearish conviction. Conversely, weak volume during any rebound indicates limited buying interest, suggesting that price increases might not be sustainable.


