Urgent Bitcoin Price Alert: Is This the Deepest Drawdown of the Bull Market?
Hold onto your hats, crypto enthusiasts! The Bitcoin rollercoaster is taking another dip, and analysts are sounding the alarm. Is this just a regular bump in the bull market, or are we staring down the barrel of the largest Bitcoin price drawdown this cycle? Let’s dive into the latest market analysis and see what’s brewing in the crypto sphere.
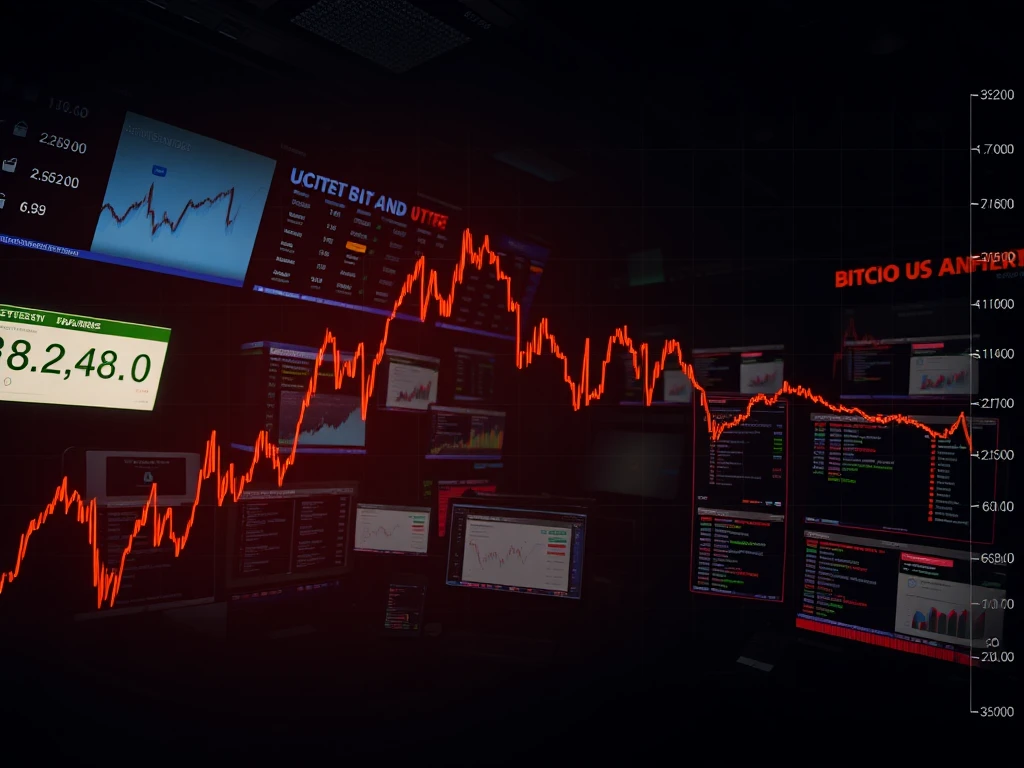
Is Bitcoin Experiencing a Major Price Drawdown?
According to Julio Moreno, head of research at CryptoQuant, Bitcoin’s price drawdown from its all-time high is currently at 26.62%. This decline is significant and on track to become the most substantial correction we’ve seen in this bull market. Take a look at this comparison to understand the scale:
| Market Event | Drawdown Percentage |
|---|---|
| 2018 Bear Market | 83% |
| 2022 Bear Market | 73% |
| Current Drawdown (as of article) | 26.62% |
While the current drop is less severe than previous bear market crashes, it’s still a jolt to the system. But how does this crypto market correction stack up against historical trends and what could it mean for the future of Bitcoin?
Historical Context: Bitcoin Drawdowns in Bull and Bear Markets
Bitcoin is known for its volatility, and drawdowns are part of the game. Historically, both bull and bear markets have seen significant price corrections. Let’s consider:
- Past Bear Markets: As the data shows, bear markets in 2018 and 2022 witnessed massive drawdowns exceeding 70%. These were periods of prolonged price decline and market capitulation.
- Current Bull Market Context: Even within a bull market, corrections are normal and even healthy. They can shake out weak hands, cool down overheated markets, and set the stage for the next leg up.
The key question now is whether this current Bitcoin price drawdown is just a healthy correction within the bull market or something more ominous. Analysts are divided, and various factors are at play.
Nasdaq’s Role: Is It Impacting Bitcoin’s Recovery?
Ecoinometrics, a crypto and macro resource, points to a potential hurdle for a quick Bitcoin recovery: the Nasdaq 100. Here’s the gist:
- Nasdaq Performance Matters: Historically, when the Nasdaq 100 underperforms its long-term average, Bitcoin’s growth tends to slow down.
- Correlation Concerns: Bitcoin’s price recovery might be challenging if the Nasdaq 100 remains flat or under pressure.
- Increased Correction Risk: A weak Nasdaq could even increase the risk of a more severe crypto market correction for Bitcoin.
The correlation between traditional markets and crypto is a topic of ongoing debate, but this analysis suggests that macro factors could indeed influence Bitcoin’s short-term trajectory.
Michael Saylor’s Strategy on Defense: Halting Bitcoin Buys
The recent Bitcoin price dip has even put MicroStrategy’s famous Bitcoin accumulation strategy on hold. Key takeaways:
- Paused Purchases: MicroStrategy, known for its aggressive Bitcoin buying, did not purchase any BTC between March 31 and April 6. This could indicate a cautious approach in the face of market uncertainty.
- Return Under Pressure: Despite spending billions on Bitcoin, MicroStrategy’s holdings are currently showing a modest 17% return over five years. This highlights the impact of market volatility on even long-term Bitcoin strategies.
While a temporary pause in buying doesn’t necessarily signal a change in MicroStrategy’s long-term bullish stance, it does reflect the current market pressure.
Critical Support Levels: Can Bitcoin Hold Above $70K?
Where does Bitcoin go from here? Technical analysis provides some crucial levels to watch:
- 50-Weekly EMA Test: Bitcoin recently tested its 50-weekly exponential moving average for the first time since September 2024. Historically, breaking below this level on the weekly chart has signaled the start of bear markets.
- Immediate Support at $74,000: This level represents the early 2024 all-time high and could act as initial support.
- Stronger Demand Zone at $65,000 – $69,000: This zone is considered a significant liquidity level and includes the 2021 all-time high of $69,000. It could provide stronger support if the price continues to fall.
Monitoring these levels will be crucial in determining the extent and duration of this Bitcoin drawdown.
RSI Indicator: Is a Bitcoin Price Recovery Imminent?
The Relative Strength Index (RSI), a momentum indicator, offers some potential clues:
- Lowest RSI Since January 2023: Bitcoin’s weekly RSI has dropped to its lowest point since early 2023.
- Past RSI Recoveries: In August 2023 and September 2024, similar RSI levels preceded Bitcoin price recoveries. This offers a glimmer of hope for a potential turnaround.
- Bearish RSI Below 40: However, a drop below 40 on the RSI in 2022 signaled a full-blown bear market. This highlights the importance of watching RSI trends carefully.
Rekt Capital, a well-known crypto trader, suggests that based on daily RSI trends, the bottom of this correction could be anywhere from current prices down to around $70,000.
Conclusion: Navigating the Bitcoin Price Correction
The current Bitcoin price drawdown is undoubtedly significant and warrants attention. While analysts debate whether it’s the deepest correction of this Bitcoin bull market, it’s crucial to stay informed and understand the key factors at play.
Key Takeaways:
- Bitcoin is experiencing a notable drawdown, potentially the largest of this bull cycle.
- Nasdaq performance and RSI levels are key indicators to watch for potential recovery or further decline.
- Critical support levels at $74,000 and $65,000 – $69,000 will be crucial in determining the market’s next move.
Remember, the crypto market is inherently volatile. Conduct your own research, manage your risk wisely, and stay tuned for further developments in this unfolding Bitcoin analysis. This is not investment advice, but staying informed is your best tool in navigating these turbulent waters.


