Crucial TIBBIR Price Moment: Inverse Head and Shoulders Pattern Hints at Explosive 30% Upside

Are you keeping an eye on the ever-evolving world of digital assets? Then you won’t want to miss the latest developments concerning TIBBIR, a crypto asset that’s currently at a pivotal juncture. Technical analysts are buzzing about a significant pattern emerging on its charts, one that could signal a substantial shift in its trajectory. The TIBBIR price is nearing a critical resistance level, and if certain conditions are met, we could be looking at a remarkable upside potential of 30%!
Understanding the Inverse Head and Shoulders: A Powerful Bullish Reversal Signal
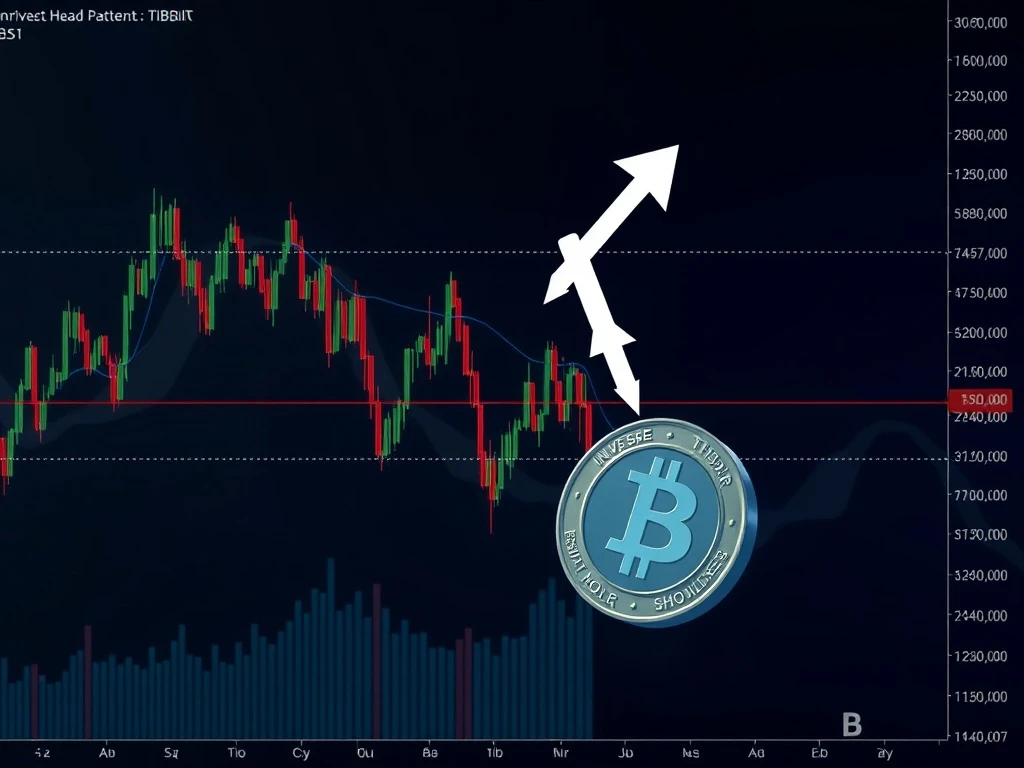
For those deep into crypto technical analysis, few patterns generate as much excitement as the Inverse Head and Shoulders. It’s a classic bullish reversal formation, typically appearing after a prolonged downtrend, indicating that sellers are losing control and buyers are stepping in. Here’s a quick breakdown of its components:
- Left Shoulder: A low point in price, followed by a rebound.
- Head: A deeper low than the left shoulder, also followed by a rebound, often indicating the peak of selling pressure.
- Right Shoulder: A higher low than the head, but typically similar in depth to the left shoulder, signifying diminishing selling pressure.
- Neckline: A resistance line connecting the peaks between the shoulders and the head. This line can be horizontal or, as in TIBBIR’s case, descending.
The significance of this pattern lies in its ability to predict a strong upward movement once the price breaks decisively above the neckline. It’s a roadmap for a potential trend change, shifting from bearish to bullish momentum.
TIBBIR’s Critical Neckline Challenge: What’s at Stake for the TIBBIR Price?
TIBBIR finds itself in a high-stakes scenario. The asset has recently formed a clear Inverse Head and Shoulders pattern, as highlighted by prominent analysts. The crucial neckline resistance for TIBBIR is identified at approximately $0.0000000085. This isn’t just any arbitrary line; it’s the gateway to validating the pattern and unlocking its projected upside.
Historically, a confirmed breakout above such a neckline, especially on strong trading volume, often propels the asset significantly higher. For TIBBIR, analysts are eyeing a potential move towards the $0.000000011–$0.000000012 range. This represents a substantial 30% surge from the current neckline, a tantalizing prospect for investors looking for a bullish reversal.
The recent price action underscores the asset’s inherent volatility. While specific intraday numbers from the original source might have been inconsistent, the underlying message is clear: TIBBIR has experienced significant price swings around its current levels, reflecting a fierce battle between buyers and sellers. The price currently hovers just below the daily open, indicating a short-term bearish bias, yet the potential for a rebound remains palpable.
Decoding TIBBIR’s Technical Signals: Mixed Messages in the Altcoin Market
Beyond the compelling chart pattern, other technical indicators offer a nuanced view of TIBBIR’s immediate future within the broader altcoin market:
- Relative Strength Index (RSI): TIBBIR’s RSI has plummeted to an extreme 13.77. This reading signals deeply oversold conditions. In many cases, such low RSI values precede a short-term rebound as the asset becomes attractive to buyers looking for value.
- Moving Average Convergence Divergence (MACD): In contrast, the MACD remains bearish. The signal line is still above the MACD line, and the histogram remains flat, suggesting that the bearish momentum, while perhaps weakening, hasn’t fully dissipated. This indicates that while a bounce is possible due to oversold conditions, a sustained upward trend requires more fundamental shifts in momentum.
These mixed signals paint a picture of precarious balance. The extreme RSI offers a glimmer of hope for a bounce, but the MACD suggests that any rally might be short-lived unless it’s accompanied by strong buying pressure and a decisive breakout. Traders are keenly observing how TIBBIR interacts with the $0.0000000085 neckline. A clear breach could shift sentiment dramatically towards optimism, while a failure to hold above this level might prolong the asset’s consolidation phase or even lead to further downside.
Navigating Volatility: Actionable Insights for TIBBIR Traders
The current environment for TIBBIR demands a cautious yet informed approach. Here are some actionable insights for traders and investors:
- Confirm the Breakout: Do not jump in solely based on the pattern. A confirmed breakout above the $0.0000000085 neckline on strong volume is crucial. Look for a daily close above this level, ideally with increased trading activity.
- Monitor Support Levels: The $0.0752 support level (scaled to be consistent with the neckline, indicating a critical floor below current prices) is paramount. A breakdown below this point could intensify selling pressure. Conversely, a recovery to the $0.0788 zone (similarly scaled) might empower buyers to retest recent highs and the neckline.
- Risk Management: Given the volatility, implementing robust stop-loss orders is vital to protect capital in case the pattern fails to materialize or the market experiences a broader downturn.
- Volume is Key: A genuine breakout will typically be accompanied by a significant surge in trading volume. Lack of volume during a price increase near the neckline could indicate a false breakout.
- Broader Market Context: Always consider the overall altcoin market sentiment and Bitcoin’s performance. A strong Bitcoin can often pull altcoins higher, while a downturn can drag them down, regardless of individual chart patterns.
The Road Ahead for TIBBIR: Opportunities and Challenges
The current setup presents both significant opportunities and inherent risks for TIBBIR. The potential for a 30% upside from a validated Inverse Head and Shoulders pattern is undeniably attractive, positioning TIBBIR for a powerful bullish reversal. However, the path is fraught with challenges, including persistent bearish MACD signals and the broader market’s sensitivity to liquidity pressures. The battle at the $0.0000000085 neckline will be decisive.
As traders adopt a cautious approach, the behavior of TIBBIR around its critical inflection points, particularly the neckline and key support levels, will dictate its next phase. While the recent rebound offers a glimmer of hope, sustained recovery hinges on the successful resolution of these technical battles. Keep a close watch on TIBBIR; its next move could be monumental.
Frequently Asked Questions (FAQs)
Q1: What is an Inverse Head and Shoulders pattern and why is it important for TIBBIR?
A1: The Inverse Head and Shoulders is a bullish chart pattern indicating a potential reversal from a downtrend to an uptrend. It’s important for TIBBIR because its formation suggests that selling pressure is waning, and a breakout above its neckline resistance could lead to significant price appreciation, as much as 30% according to current analysis.
Q2: What is the critical neckline resistance level for TIBBIR?
A2: The critical neckline resistance for TIBBIR is identified at approximately $0.0000000085. A confirmed breakout above this level, ideally with strong volume, is essential to validate the Inverse Head and Shoulders pattern and trigger the projected upside.
Q3: What do TIBBIR’s technical indicators (RSI and MACD) suggest?
A3: TIBBIR’s RSI is at 13.77, indicating deeply oversold conditions, which often precedes a short-term rebound. However, the MACD remains bearish, suggesting that while a bounce is possible, a sustained bullish trend hasn’t been confirmed yet. These mixed signals highlight the ongoing tug-of-war between buyers and sellers.
Q4: What is the projected upside potential for TIBBIR if the pattern is confirmed?
A4: If the Inverse Head and Shoulders pattern is confirmed with a decisive breakout above the neckline, analysts project a potential 30% upside for TIBBIR, aiming for the $0.000000011–$0.000000012 range.
Q5: What should traders look for to confirm a TIBBIR breakout?
A5: Traders should look for a clear daily close above the $0.0000000085 neckline, accompanied by a significant increase in trading volume. Monitoring key support levels and broader market sentiment is also crucial for confirming the validity and sustainability of the breakout.


