Stellar (XLM) Plummets 6% as Bearish Momentum Intensifies – Key Levels to Watch
Stellar (XLM) has taken a sharp downturn, breaking below its critical 10-day SMA and shedding 6% of its value in a single day. This sudden shift has sent shockwaves through the crypto market, leaving investors scrambling to understand the implications. Let’s dive deep into what’s driving this bearish momentum and what it means for XLM’s future.
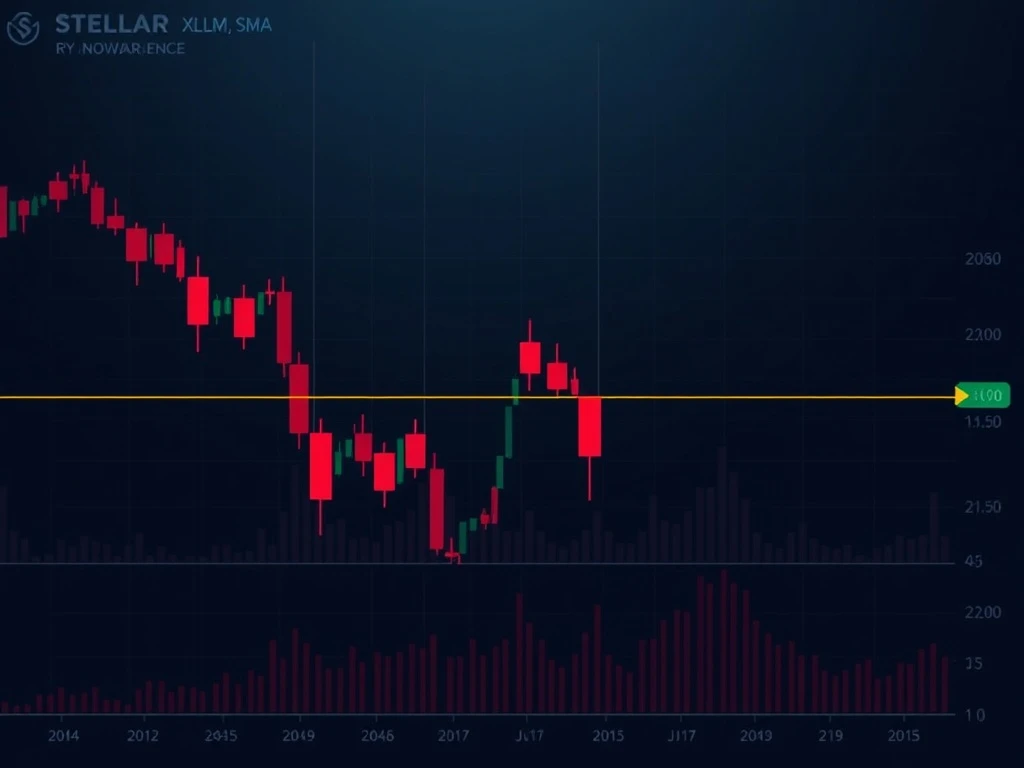
Stellar XLM’s Technical Breakdown: A Bearish Signal
The recent price action shows Stellar XLM decisively breaking below its 10-day simple moving average (SMA), a key technical level that had previously served as strong support. This breakdown occurred with:
- Higher than average selling volume
- A 6% single-day price drop
- An 8% decline over the past week
What Does the 10-Day SMA Break Mean for XLM?
Technical analysts are sounding the alarm about this development. As chart analyst Ali Martinez notes, “The 10-day SMA often acts as a critical line in the sand – bullish above, bearish below.” The current situation suggests:
| Indicator | Current Status | Implications |
|---|---|---|
| 10-day SMA | Broken | Bearish short-term outlook |
| Bull-Bear Power | -0.0182 | Seller dominance increasing |
| Key Support | $0.42-$0.45 | Critical decision zone |
Stellar XLM Price Predictions: Bull vs Bear Scenarios
The market is divided on XLM’s future trajectory. While some analysts like Javon Marks point to historical patterns suggesting potential rebounds to $0.79783 or even $8.00, others like Peter Brandt warn of possible stagnation if XLM fails to hold above $0.22 or break $1 decisively.
Market Analysis: Sector-Wide Challenges Impacting XLM
Stellar isn’t facing these challenges alone. The broader altcoin market shows similar struggles, with XRP experiencing a 37% volume decline in July. However, XLM’s unique position in cross-border payments and its growing ecosystem could provide some insulation from broader market trends.
Actionable Insights for XLM Investors
For those holding or considering XLM positions, here are key factors to monitor:
- On-chain volume and wallet activity
- The $0.42-$0.45 support zone
- Potential retest of the 10-day SMA
- Broader market sentiment
The current volatility in Stellar XLM’s price presents both risks and opportunities. While the bearish momentum is undeniable, the cryptocurrency’s strong fundamentals and historical resilience suggest this could be a temporary setback rather than a long-term trend reversal. Careful monitoring of technical indicators and market conditions will be crucial in the coming days.
Frequently Asked Questions
Why did Stellar XLM price drop suddenly?
The price dropped due to a combination of technical factors (breaking below the 10-day SMA) and broader market sentiment shifting bearish on altcoins.
What is the significance of the 10-day SMA break?
The 10-day SMA acts as a short-term momentum indicator. Breaking below it typically signals weakening bullish momentum and potential further downside.
Where is the next support level for XLM?
The $0.42-$0.45 range is currently acting as support. If this fails, the next major support zone is around $0.30.
Are analysts still bullish on XLM long-term?
Opinions are divided. Some see this as a buying opportunity, while others warn of potential stagnation if key levels aren’t reclaimed.
How does XLM’s drop compare to other altcoins?
Many altcoins are experiencing similar pullbacks, though XLM’s technical breakdown appears more pronounced than some peers.
What should investors watch for in coming days?
Key factors include whether XLM can reclaim the 10-day SMA, trading volume patterns, and broader crypto market sentiment.