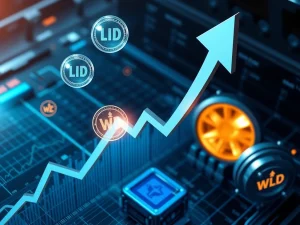
SQD Skyrockets 29.0% in 24 Hours, Crushing 200MA and 200EMA Resistance
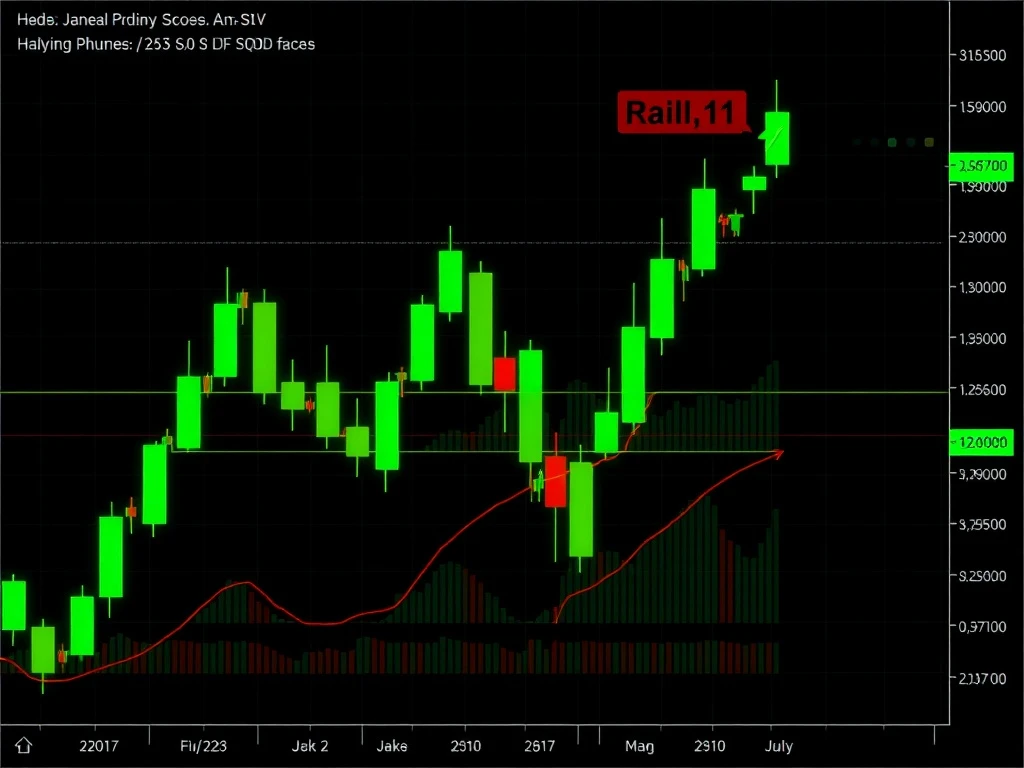
In a stunning move, SQD has surged 29.0% in just 24 hours, breaking past critical resistance levels at the 200-day moving average (200MA) and 200-day exponential moving average (200EMA). This explosive rally has traders buzzing—could this be the start of a sustained uptrend?
SQD’s Breakout: Key Levels to Watch
SQD’s price action has been nothing short of impressive. After bouncing from a crucial support level at $0.12517, the token has reclaimed the $0.19–$0.28 range. Here’s what you need to know:
- Resistance Break: SQD surpassed $0.18723, a level that previously capped rallies in July.
- Volume Surge: Increased trading volume supports the breakout, signaling strong buyer interest.
- Next Target: The $0.2317 resistance level, where prices faced rejection in late May, is now in focus.
Why the 200MA and 200EMA Matter for SQD
Moving averages act as critical indicators for traders. SQD’s breach of both the 200MA and 200EMA suggests a potential shift in market sentiment. Historically, holding above these levels could signal further upside.
Trading Volume: The Fuel Behind SQD’s Rally
A breakout without volume is like a car without gas—it won’t go far. Fortunately, SQD’s surge was accompanied by a noticeable spike in trading activity, reinforcing the bullish case.
What’s Next for SQD?
Traders are closely watching:
- Sustained Closes Above $0.18723: Essential for confirming a trend reversal.
- Volume Trends: Continued high volume will be key to maintaining momentum.
- Market Sentiment: Broader crypto market conditions could influence SQD’s trajectory.
SQD’s rally is a reminder of how quickly crypto markets can move. Whether this breakout holds or fades, one thing is clear: volatility is back on the menu.
Frequently Asked Questions (FAQs)
What caused SQD’s 29% rally?
The rally was driven by a rebound from key support at $0.12517, increased trading volume, and a breakout above the 200MA and 200EMA.
Is SQD’s breakout sustainable?
Sustainability depends on holding above $0.18723 with strong volume. Traders should monitor daily closes for confirmation.
What is the next resistance level for SQD?
The next major resistance is at $0.2317, a level where sellers previously stepped in.
How does the 200MA impact SQD’s price?
The 200MA is a long-term trend indicator. Breaking above it often signals bullish momentum.
Should traders buy SQD now?
While the breakout is promising, traders should assess risk tolerance, volume trends, and broader market conditions before entering.