Unlocking SOLVUSDT: A Comprehensive 24-Hour Crypto Technical Analysis Report

In the dynamic world of cryptocurrencies, staying ahead means understanding the subtle shifts in market sentiment and price action. Today, we dive deep into a critical market overview of SOLVUSDT, providing a comprehensive 24-hour technical summary that could be pivotal for your next move. Whether you’re a seasoned trader or just starting, decoding these patterns can unlock profitable opportunities in the crypto space.
SOLVUSDT: What Did the Last 24 Hours Reveal?
The past 24 hours for SOLVUSDT, from July 25th to July 26th, 2025, presented a fascinating picture of consolidation and indecision. Opening at $0.04109, the pair experienced a tight trading range between $0.04112 and $0.04176, ultimately closing near its 24-hour low at $0.0414. This narrow range, coupled with a total volume of 5,966,047.0 and a notional turnover of $246,644.67, suggests a market grappling for clear direction.
Key observations from this period include:
- Price Range: A constricted movement between $0.04112 and $0.04176, highlighting a lack of strong directional conviction.
- Closing Position: The close at $0.0414, near the lower end of the range, indicated a slight bearish lean as the period concluded.
- Volume & Turnover: While volume saw spikes, particularly in the afternoon and early evening, the corresponding notional turnover didn’t always match, suggesting weak conviction behind some price movements.
How is Solv Protocol’s Price Structure Evolving?
Understanding the underlying structure and formations of Solv Protocol‘s price action is crucial for anticipating future movements. On the 15-minute chart, SOLVUSDT has been caught in a defined range. Key levels were repeatedly tested, indicating a tug-of-war between buyers and sellers:
- Resistance at $0.04161: This level proved to be a strong ceiling, repelling multiple attempts to break higher.
- Support at $0.04141: Acting as a floor, this level provided temporary stability, preventing deeper corrections.
- Bearish Engulfing & Doji: A bearish engulfing pattern near $0.04161 signaled a potential reversal, followed by a doji near $0.04156, emphasizing market indecision. This sequence often precedes a period of consolidation, hinting at a potential breakout or breakdown ahead.
Diving Deep: Essential Crypto Technical Analysis Indicators
To truly grasp the market’s pulse, we turn to the most reliable tools in crypto technical analysis. These indicators provide valuable insights into momentum, volatility, and potential turning points for SOLVUSDT:
Moving Averages: Trend or Sideways?
On the 15-minute chart, the 20-period and 50-period moving averages are tightly intertwined, reinforcing the idea of a range-bound market lacking a dominant trend. The 50-period MA sitting just above the 20-period MA subtly hints at mild bearish pressure. Zooming out to the daily chart, the convergence of the 50, 100, and 200-period lines further supports a neutral to bearish outlook, suggesting a market in search of its next major direction.
MACD & RSI: Momentum and Overbought Signals
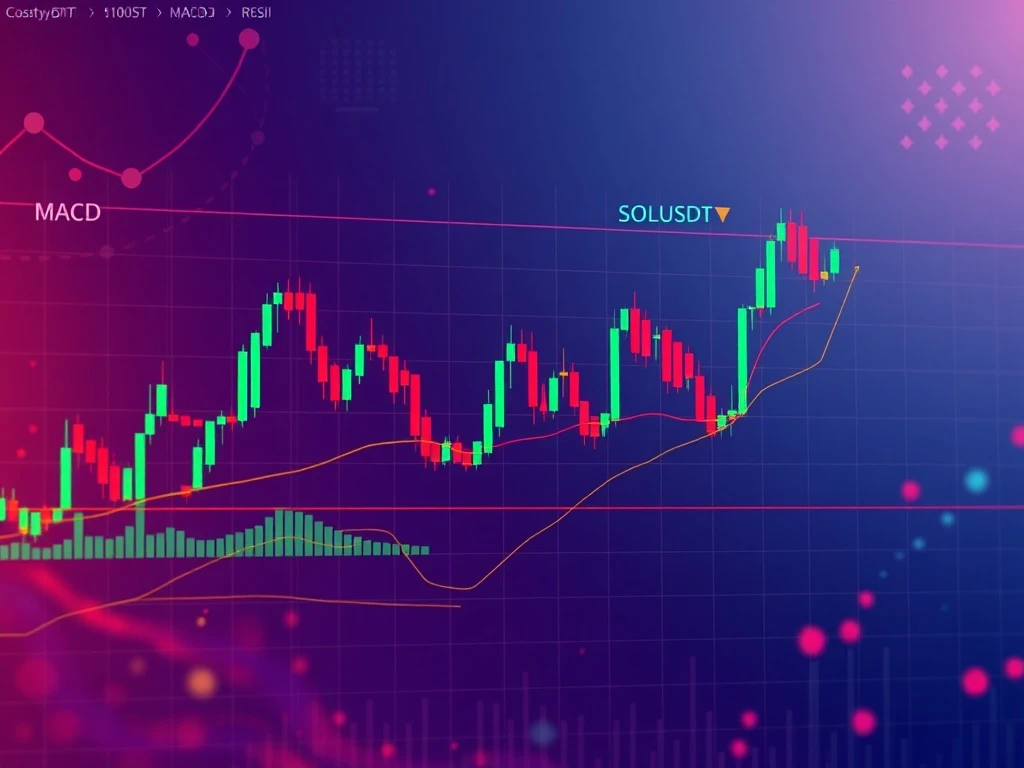
The MACD (Moving Average Convergence Divergence) line turning negative in the early hours was a clear signal of weakening bullish momentum. This shift indicates that the short-term average is moving below the longer-term average, often a precursor to price declines. Meanwhile, the RSI (Relative Strength Index) largely stayed between 50 and 60, occasionally venturing into overbought territory. This suggests a market lacking strong conviction in either direction, possibly gearing up for a corrective phase after brief surges.
Bollinger Bands: Volatility Check
Bollinger Bands provide a visual representation of volatility. During the early hours, volatility expanded as the price touched the upper band at $0.04176. However, it quickly contracted, pulling the price back towards the middle band. The current price of $0.0414, hovering near the lower band, suggests that SOLVUSDT is at a critical juncture. A move below could signal a breakdown, while a bounce could indicate renewed buying interest.
Crafting Your Trading Strategy: What Do Volume and Fibonacci Tell Us?
Effective trading strategy relies heavily on interpreting volume and key price levels. The past 24 hours for SOLVUSDT offered several cues:
Volume & Turnover: The Conviction Indicator
Volume spikes, particularly between 15:00 and 19:00 ET, coincided with attempts to breach the $0.04161 resistance. However, the lack of matching notional turnover behind these spikes suggests that these were not backed by strong buying conviction. A notable divergence between price and turnover was observed in the later hours, which often signals potential exhaustion in the prevailing trend. This divergence is a warning sign for bulls, indicating that upward moves may lack genuine strength.
Fibonacci Retracements: Identifying Support Zones
Applying Fibonacci retracements to the recent 15-minute swing from $0.04112 to $0.04176 provides critical support levels for traders to watch. The 38.2% retrace level stands at $0.04146, and the 61.8% level is at $0.04130. With the current price near the 61.8% level, this zone becomes a potential support area for the next 24 hours. A bounce from here could indicate a continuation of the range, while a break below could lead to further declines.
What Does the SOLVUSDT Market Overview Suggest for the Near Future?
Based on this detailed market overview, SOLVUSDT appears to be in a consolidation phase, poised for a significant move. The defined range between $0.04141 and $0.04161 is the battleground for the immediate future. For investors and traders, this period demands vigilance and a well-thought-out approach:
- Bullish Scenario: A decisive break and sustained close above $0.04161 could ignite renewed bullish momentum, potentially leading to a retest of higher resistance levels.
- Bearish Scenario: Conversely, a firm close below $0.04141 would signal a breakdown from the current consolidation, potentially leading to a deeper correction.
Given the observed divergences and weakening momentum indicators, caution is advised. Pay close attention to volume confirmation on any breakout or breakdown. The market is setting the stage for its next act, and understanding these technical signals will be paramount.
The past 24 hours for SOLVUSDT underscore the importance of meticulous technical analysis in navigating volatile crypto markets. From tight trading ranges and key support/resistance tests to nuanced indicator readings and volume divergences, every piece of data tells a story. While the immediate future points to consolidation, the potential for a decisive move is high. By staying informed and recognizing these critical technical signals, you can position yourself more effectively in the ever-evolving world of digital assets. Always remember to conduct your own research and manage risk diligently.
Frequently Asked Questions (FAQs)
1. What was the trading range for SOLVUSDT in the past 24 hours?
SOLVUSDT traded in a tight range between $0.04112 and $0.04176 over the 24-hour period, indicating a phase of consolidation rather than a strong directional trend.
2. What do the Moving Averages suggest about SOLVUSDT’s trend?
On the 15-minute chart, the 20-period and 50-period moving averages are closely aligned, suggesting a lack of clear trend. On the daily chart, the convergence of the 50, 100, and 200-period lines indicates a neutral to slightly bearish bias.
3. How did volume and turnover behave for Solv Protocol (SOLVUSDT)?
Volume spiked in the afternoon and early evening, coinciding with attempts to break resistance. However, notional turnover did not consistently match these spikes, suggesting weak conviction. A divergence between price and turnover was also observed, hinting at potential trend exhaustion.
4. What are the key support and resistance levels for SOLVUSDT?
Key resistance for SOLVUSDT is identified at $0.04161, while strong support is found at $0.04141. These levels define the current consolidation range.
5. What does the Fibonacci Retracement tell us about potential support?
Based on the recent 15-minute swing, the 61.8% Fibonacci retrace level at $0.04130 is identified as a potential support zone for SOLVUSDT in the next 24 hours.
6. What is the forward-looking view for SOLVUSDT?
SOLVUSDT is consolidating within the $0.04141–$0.04161 range. A break above $0.04161 could signal renewed bullish momentum, while a close below $0.04141 may indicate a deeper correction. Investors should watch for volume confirmation on any breakout.


