Unlocking Solv Protocol (SOLVUSDT): A Critical 24-Hour Technical Analysis for Traders
In the fast-paced world of cryptocurrency, understanding market dynamics is paramount. For traders eyeing Solv Protocol (SOLVUSDT), the last 24 hours have presented a fascinating study in consolidation and potential turning points. This detailed crypto technical analysis delves into the recent movements of SOLVUSDT, offering insights into its current state and what might lie ahead. Whether you’re a seasoned trader or new to the game, grasping these nuances is crucial for developing effective trading strategies.
SOLVUSDT: A Glimpse into the Latest 24-Hour Performance
The recent 24-hour trading window for Solv Protocol (SOLVUSDT) provided a compelling narrative of price action. Opening at 0.04225 on July 22, 2025, and closing at 0.04201 on July 23, 2025, the token demonstrated a relatively tight trading range between 0.04125 and 0.0425. This narrow band suggests a period of consolidation, where buyers and sellers are in a state of equilibrium, potentially setting the stage for a significant move.
- Key Reversal: A notable bullish reversal pattern formed near 0.04125, signaling strong buying interest at that level, which subsequently led to a steady rally towards 0.0425.
- Tightening Range: Price spent most of the 24-hour period consolidating between 0.0415 and 0.0425, indicating reduced volatility and a potential build-up of energy.
- Volume Spikes: Significant volume surges were observed at the 0.04125 support and 0.0425 resistance levels. These spikes are critical as they often confirm the strength of these price points, reflecting increased trader activity.
- Overall Activity: Total trading volume reached 13,846,448.0, with a notional turnover of $586,255.00, highlighting active participation within this tight range.
Mastering Crypto Technical Analysis: Chart Patterns and Key Levels
To truly understand SOLVUSDT‘s movements, a closer look at its chart patterns and structural formations is essential. The 15-minute chart provides granular detail, revealing the interplay of bullish and bearish forces.
- Bearish Breakdown & Recovery: Initially, a bearish breakdown occurred at 0.04125, but this was swiftly followed by a sharp recovery to 0.0425, demonstrating resilience from buyers.
- Bullish Engulfing Pattern: The formation of a bullish engulfing pattern near the 0.04125 level reinforced its role as a short-term support zone. This pattern typically indicates a shift in momentum from sellers to buyers.
- Doji Candlestick: A doji candlestick appeared near 0.0420, signaling market indecision. This often occurs when neither buyers nor sellers can gain control, leading to a period of pause before the next directional move.
Critical Support and Resistance Levels for SOLVUSDT:
Identifying these levels is fundamental for any crypto technical analysis, as they act as barriers or magnets for price action.
| Type | Level 1 | Level 2 |
|---|---|---|
| Resistance | 0.0425 | 0.04235 |
| Support | 0.0420 | 0.04175 |
Navigating the Market Overview: Moving Averages and Oscillators
Moving averages and oscillators provide a broader market overview, helping traders gauge trend direction and momentum. For Solv Protocol, these indicators offer a nuanced picture.
Moving Averages (MAs):
- Short-Term Bias: On the 15-minute chart, the 20-period and 50-period moving averages are converging upward, with the price trading above both. This configuration suggests a potential short-term bullish bias, indicating that recent price action has been stronger than the average over these periods.
- Daily Perspective: Daily moving averages (50, 100, 200) remained largely neutral to slightly bullish within the 24-hour window, with no major crossovers observed. This implies that while short-term movements are showing bullish signs, the longer-term trend remains steady.
MACD & RSI: Momentum Insights:
These momentum oscillators are crucial for understanding the strength and speed of price changes.
- MACD Signals: The MACD histogram presented a mixed signal. A brief bullish crossover near 0.0413 indicated initial buying strength, but subsequent divergence as the price recovered suggests a lack of sustained momentum. Traders should watch for a clear MACD signal to confirm a stronger trend.
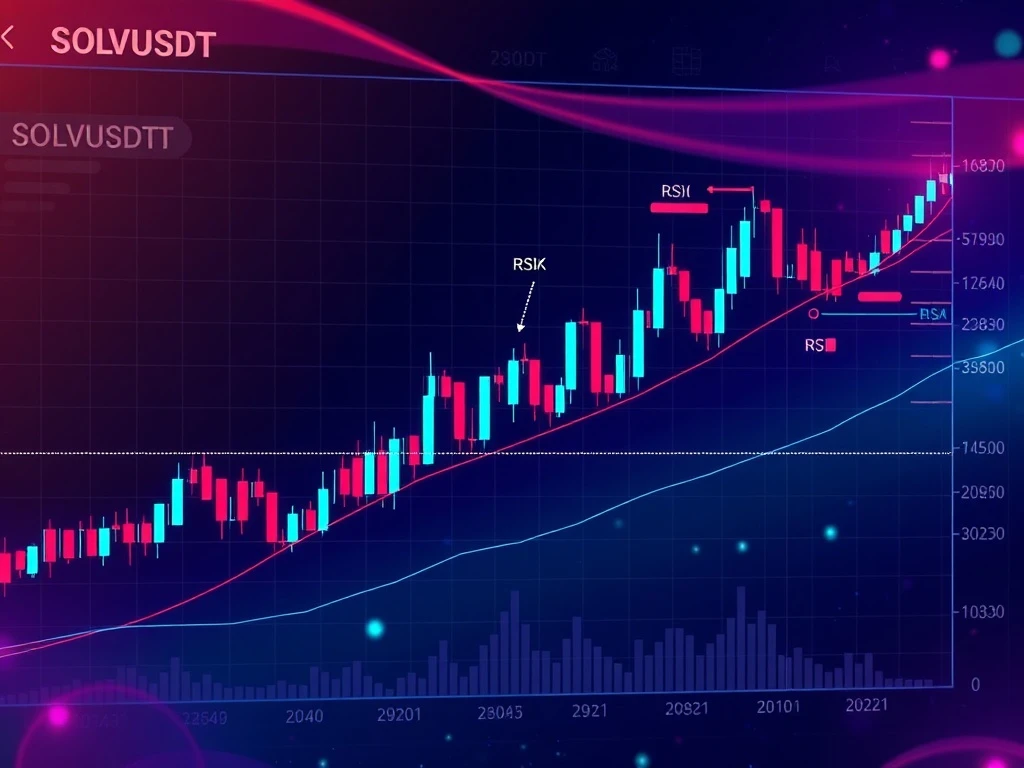
- RSI in Neutral Territory: The Relative Strength Index (RSI) remained in neutral territory, oscillating between 45 and 60. This indicates that SOLVUSDT is neither extremely overbought nor oversold. A neutral RSI often precedes a breakout, as it suggests the market is building energy without extreme directional bias.
Crafting Effective Trading Strategies: Volatility and Volume Insights
Understanding volatility and volume is key to devising robust trading strategies. For Solv Protocol (SOLVUSDT), these elements provide valuable clues about potential future movements.
Bollinger Bands: Gauging Volatility:
Bollinger Bands help visualize price volatility and potential breakout points.
- Moderate Volatility: Volatility for SOLVUSDT was moderate, with the Bollinger Bands narrowing slightly in the middle of the 24-hour period. Band narrowing often precedes a significant price move, as it indicates a squeeze in price action.
- Continuation Phase: Price spent most of its time between the mid-band and the upper band. This positioning typically suggests a continuation phase, where the existing trend (even if sideways) is likely to persist until a strong catalyst emerges.
- Breakout Potential: A potential breakout could occur if the price decisively pushes above the upper band (0.0425) or breaks below the lower band, specifically 0.04175.
Volume & Turnover: Confirming Conviction:
Volume provides insight into the conviction behind price movements.
- Strategic Volume Spikes: Volume spiked at critical levels: 0.04125 (confirming the bullish reversal) and 0.0425 (indicating resistance). These high-volume interactions at key levels underscore their significance.
- Notional Turnover: The increase in notional turnover aligned with price movement, particularly during the recovery phase. This confirms bullish momentum during the upward swing, as higher turnover with rising prices suggests strong buying interest.
- No Divergence: Crucially, no significant divergence between volume and price was observed. This suggests that the recent upward move had genuine conviction behind it, rather than being a low-volume anomaly.
Fibonacci Retracements: Pinpointing Critical SOLVUSDT Price Points
Fibonacci retracement levels are powerful tools for identifying potential support and resistance zones based on prior price swings. Applying Fibonacci levels to the recent 0.04125–0.0425 swing for Solv Protocol reveals critical points for traders to watch.
- 38.2% Retracement: This level is at 0.04192. Price has tested this level twice, suggesting it could act as a reliable short-term support. A bounce from this level would reinforce its strength.
- 61.8% Retracement: Located at 0.04157, this is often considered a strong reversal point if the price corrects deeper. A break below this level would confirm a more significant correction and potentially shift the short-term bias to bearish.
Conclusion: What’s Next for Solv Protocol (SOLVUSDT)?
In summary, Solv Protocol (SOLVUSDT) has been consolidating within a tight range over the past 24 hours, marked by distinct support and resistance levels. The technical indicators present a mixed but intriguing picture: a short-term bullish bias from moving averages, neutral momentum from RSI, and moderate volatility indicated by Bollinger Bands. Volume analysis confirms conviction in recent moves.
For traders, the immediate focus should be on the breakout potential. A sustained push above the key resistance at 0.0425 could trigger a significant upward move, while a breakdown below 0.04175 would signal a deeper correction. Given the sideways nature of the market, caution is advised. External catalysts, such as broader market sentiment or project-specific news, could trigger sharp moves in either direction. Investors should remain vigilant for volatility spikes and potential false breakouts, ensuring their trading strategies are adaptable to rapid shifts in the market.
Frequently Asked Questions (FAQs)
Q1: What does a ‘bullish reversal pattern’ mean for SOLVUSDT?
A bullish reversal pattern, like the one observed near 0.04125 for SOLVUSDT, indicates that selling pressure has diminished and buying interest is taking over. It often signals the end of a downtrend or a correction, suggesting that the price is likely to move higher.
Q2: Why are volume spikes important in Solv Protocol’s technical analysis?
Volume spikes at key price levels (like support or resistance) are important because they confirm the significance of those levels. High volume at a support level suggests strong buying interest, while high volume at resistance indicates strong selling pressure. This helps validate price movements and pattern formations.
Q3: What does it mean if RSI is in ‘neutral territory’ for SOLVUSDT?
When the Relative Strength Index (RSI) is in neutral territory (typically between 30 and 70, in this case 45-60), it means that SOLVUSDT is neither overbought nor oversold. This often suggests that the market is in a consolidation phase, building energy before a potential breakout in either direction, as there’s no immediate pressure from extreme momentum.
Q4: How do Bollinger Bands help in predicting SOLVUSDT’s future moves?
Bollinger Bands help assess volatility and potential breakout points. When the bands narrow, as seen with SOLVUSDT, it often precedes a period of increased volatility and a significant price move. If the price breaks above the upper band, it could signal a strong bullish breakout; a break below the lower band could indicate a bearish breakdown.
Q5: What are the key support and resistance levels for SOLVUSDT to watch?
Based on recent 24-hour analysis, key resistance levels for SOLVUSDT are 0.0425 and 0.04235. Key support levels are 0.0420 and 0.04175. Traders should monitor these levels closely for potential breakouts or breakdowns.


