Solana (SOLUSDT) Plunges: A Critical 24-Hour Technical Analysis Breakdown
The crypto market is a whirlwind of activity, and recently, all eyes have been on Solana (SOLUSDT). After a period of intense trading, Solana has experienced a significant bearish breakdown over the past 24 hours, leaving many investors wondering about its immediate future. Our in-depth technical analysis dives into the critical movements and technical indicators that shaped SOL’s recent performance, offering insights into what might come next and providing a comprehensive SOLUSDT forecast.
Solana (SOLUSDT) Under Pressure: What the Charts Reveal?
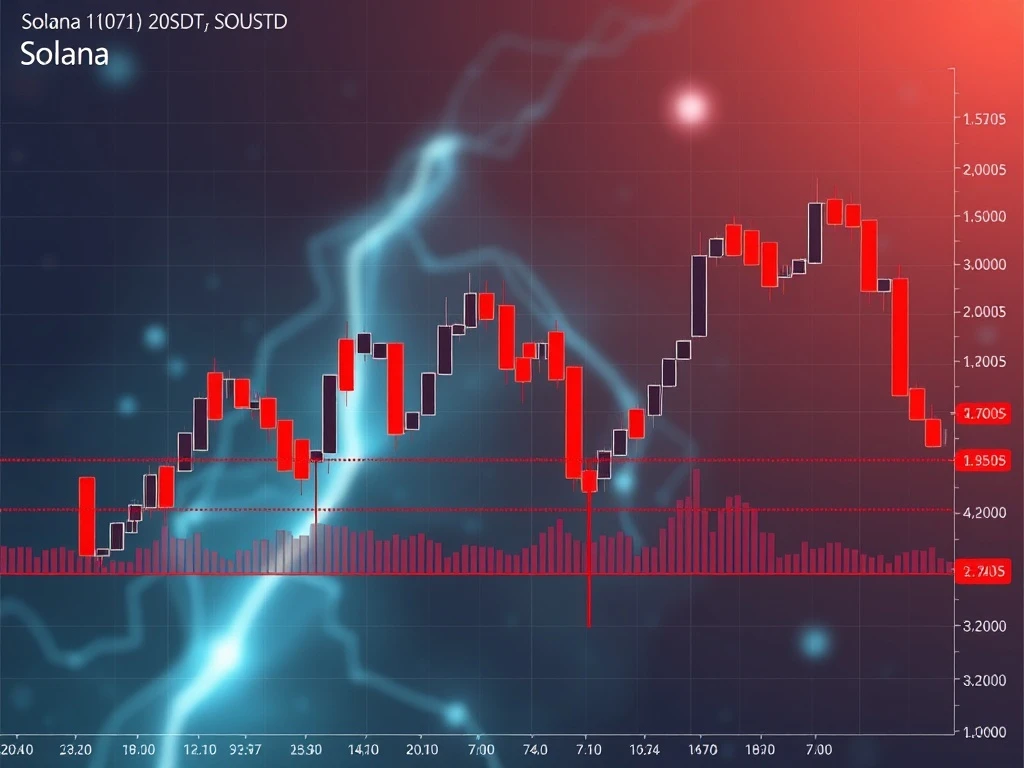
Over the past 24 hours, Solana (SOLUSDT) traded significantly lower, closing near a critical support level after a sharp bearish breakdown. The session opened at $191.25 and concluded at $185.23, reflecting a notable decline. During this period, Solana touched a high of $192.79 and a low of $184.21, showcasing considerable volatility. The total trading volume for SOL reached 1,942,770.5 SOL, translating to a notional turnover of approximately $359,142,070. This substantial turnover indicates significant market activity during the price decline.
Initial momentum indicators suggested oversold conditions, yet a concerning volume divergence raised caution about the likelihood of an immediate rebound. The formation of a bearish engulfing pattern, coupled with a breakdown below the $190.00 mark, firmly established a bearish bias for SOL. The level of $186.00 emerged as a critical near-term support to watch.
Decoding Solana Price Action: Key Levels and Patterns
A closer look at the 15-minute chart provides granular detail on Solana price analysis. We observed a clear bearish breakdown, with price action falling from a key resistance point at $192.79. This downward movement led SOL into a support cluster, specifically between $186.00 and $188.00.
- Bearish Engulfing Pattern: A significant bearish engulfing pattern formed around the $188.25–$187.38 range. This pattern is a strong reversal signal, indicating that sellers have firmly taken control from buyers, pushing prices lower.
- Doji at Close: Towards the session’s close, a doji candlestick appeared near $185.23. A doji typically signifies market indecision. In this context, it suggests that bears were consolidating their positions near the 20-period moving average, rather than showing signs of exhaustion.
These chart formations reinforce the prevailing bearish sentiment and highlight the importance of these specific price levels for short-term movements. Traders should pay close attention to whether these support levels hold or if further downside is imminent.
Understanding Crypto Market Update: Volume and Volatility Insights
The recent crypto market update for Solana reveals significant shifts in both volume and volatility, crucial aspects for any trader. Bollinger Bands, a key indicator for volatility, showed a period of contraction around $189.00–$190.00 earlier in the 24-hour cycle. This compression often precedes a significant price move, and in this case, it was followed by a sharp expansion during the subsequent selloff.
Price closed near the lower Bollinger Band at $184.21, which strongly indicates a powerful bearish move. While price nearing the lower band can sometimes suggest oversold conditions, the context of expanding bands points to sustained downward pressure rather than an immediate bounce. A potential rebound would likely face resistance at the upper band if volatility were to normalize.
Volume analysis provides further confirmation of the bearish momentum. Turnover spiked notably during the $186.00–$188.00 range, suggesting heightened activity. The 15-minute bar specifically between $188.09–$188.63 recorded the highest volume at 73,522.167 SOL. This surge in volume during a price decline typically confirms the strength of the bearish move, indicating either aggressive selling or significant distribution activity.
However, it’s important to note that volume has since moderated, which could suggest that the immediate selling momentum is waning. While this doesn’t negate the bearish trend, it implies that the intensity of the downward pressure might be decreasing, potentially leading to a period of consolidation before the next significant move.
Leveraging Technical Indicators for SOLUSDT Forecast
To gain a deeper understanding of the SOLUSDT forecast, we must analyze the interplay of various technical indicators:
Moving Averages: Trend Confirmation
On the 15-minute timeframe, Solana’s price closed below both the 20-period and 50-period moving averages. This alignment strongly reinforces the bearish momentum in the short term. The 50-period Moving Average (MA), positioned near $189.00, is now acting as a critical dynamic resistance level. Any attempts by bulls to push the price higher will likely be met with resistance at or around this MA.
Zooming out to the daily chart, the picture remains unequivocally bearish. Price action continues to trade below the 50, 100, and 200-day moving averages. This broad alignment of MAs confirms that a larger, overarching downtrend for Solana remains firmly intact, indicating that the recent 24-hour decline is part of a more extended bearish phase.
MACD & RSI: Momentum and Overbought/Oversold Conditions
The Moving Average Convergence Divergence (MACD) indicator turned negative during the selloff, accompanied by a bearish crossover in the last two hours. A negative MACD and a bearish crossover are strong signals of declining momentum and increasing selling pressure.
The Relative Strength Index (RSI) is currently at 30, which traditionally suggests that Solana is in oversold territory. While an oversold RSI often precedes a bounce, the accompanying volume divergence during the $186.00–$188.00 range introduces a layer of caution. This divergence implies that despite the oversold reading, buying interest might not be strong enough to trigger a significant rebound without a clear confirmation, ideally above the $190.00 level.
Fibonacci Retracements: Pinpointing Key Reversal Levels
Analyzing the recent swing from the high of $192.79 to the low of $184.21 using Fibonacci retracement levels provides crucial insights into potential support and resistance zones:
- The 38.2% Fibonacci retracement level is identified at $188.00.
- The 61.8% Fibonacci retracement level is at $186.70.
Price has shown consolidation near the 61.8% level, indicating that this zone is a point of contention between buyers and sellers. If the bearish bias persists, a potential test of the 78.6% Fibonacci retracement level at $184.80 is expected. Breaking below this could open the door for further declines.
What’s Next for SOLUSDT? A Cautious Outlook
Considering the confluence of bearish signals from technical indicators and price action, Solana may face a significant test of the $184.00 level in the next 24 hours if bears maintain their strong grip. The immediate outlook for Solana (SOLUSDT) remains cautious, with a clear bearish bias.
However, the crypto market is known for its volatility and rapid reversals. A potential rebound from the current oversold levels is not entirely out of the question, but it would require significant bullish momentum and, crucially, a confirmed move above $190.00 to reinvigorate the bulls. This level, coinciding with dynamic resistance from moving averages and psychological significance, would be a key turning point.
Investors and traders should remain highly cautious. While the RSI indicates oversold conditions, the accompanying volume divergence and the strong bearish patterns suggest that a bounce may not be sustainable without strong follow-through buying. Monitoring volume and momentum indicators for confirmation of any potential upward reversal is paramount.
Disclaimer: The information provided in this article is for informational purposes only and does not constitute financial advice. Cryptocurrency investments are highly volatile and risky. Readers are encouraged to conduct their own research and consult with a qualified financial advisor before making any investment decisions. The content may be generated in whole or in part by artificial intelligence.
Frequently Asked Questions (FAQs)
1. What caused Solana’s recent price drop?
Solana experienced a sharp bearish breakdown primarily due to aggressive selling pressure, evidenced by a bearish engulfing pattern and significant volume spikes during the decline. The price broke below key support levels, reinforcing the bearish sentiment.
2. What are the key support and resistance levels for SOLUSDT to watch?
Key support levels include the cluster between $186.00 and $188.00, with a critical near-term test expected at $184.00 and potentially $184.80 (78.6% Fibonacci). Key resistance levels include the 20-period moving average and the 50-period moving average near $189.00, as well as the psychological $190.00 mark.
3. Are Solana’s technical indicators suggesting a rebound?
While the Relative Strength Index (RSI) is at 30, suggesting oversold conditions, other indicators and patterns temper expectations for an immediate rebound. The MACD shows negative momentum, and a volume divergence indicates a lack of strong buying interest. A confirmed rebound would likely require a break above $190.00.
4. How do moving averages indicate Solana’s trend?
On the 15-minute chart, Solana’s price closed below both the 20-period and 50-period moving averages, signaling short-term bearish momentum. On the daily chart, the price remains below the 50, 100, and 200-day moving averages, confirming a broader, long-term downtrend remains intact.
5. What is the significance of volume divergence in Solana’s recent price action?
Volume divergence, especially when an asset is oversold (like Solana’s RSI at 30) but volume is not confirming a potential reversal, suggests that there isn’t strong buying interest to support a bounce. It indicates that the oversold condition might not lead to an immediate or sustained price recovery without further catalysts.
6. What is a bearish engulfing pattern and why is it important for Solana?
A bearish engulfing pattern is a candlestick formation where a large red (bearish) candle completely engulfs the body of the previous smaller green (bullish) candle. For Solana, its formation around $188.25–$187.38 was a strong signal of a short-term reversal, indicating that sellers had overwhelmed buyers and were pushing the price down aggressively.