Solana (SOLUSDT) Plunges 6.8%: 24-Hour Technical Breakdown and Trading Insights
Solana (SOLUSDT) experienced a dramatic 6.8% price drop in just 24 hours, sending shockwaves through the crypto market. This technical breakdown reveals critical support levels, oversold conditions, and potential reversal signals that every trader should watch.
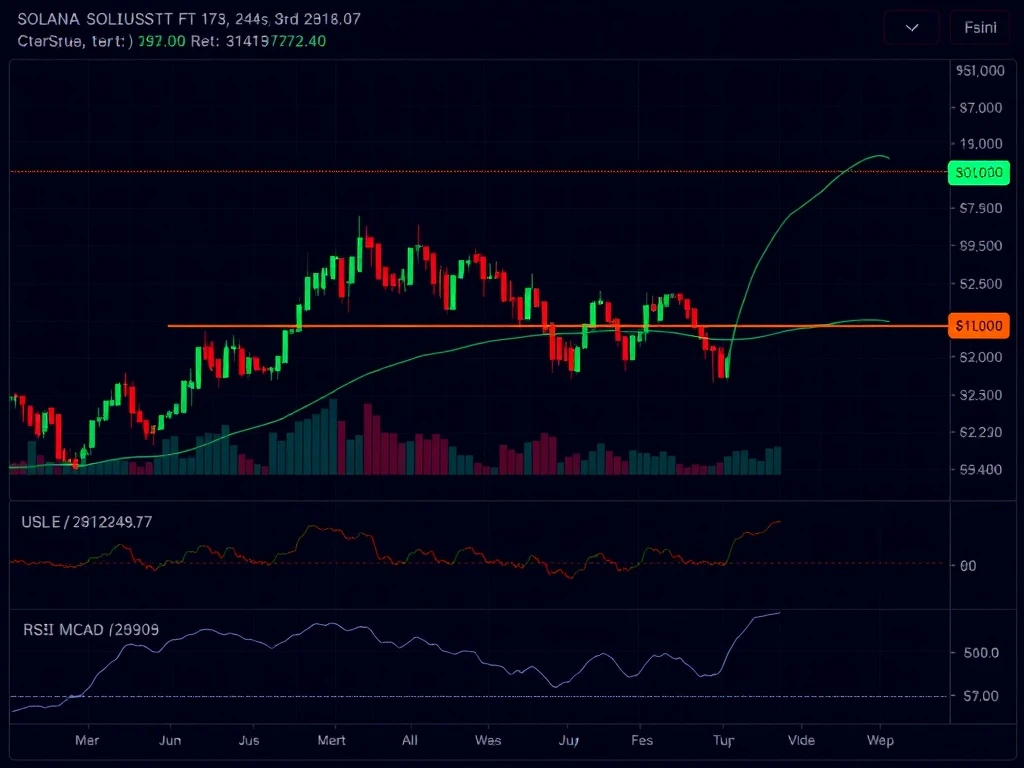
Solana Price Action: A Bearish 24-Hour Rollercoaster
The SOLUSDT pair opened at $177.20 before plunging to $167.42, with these key developments:
- 24-hour high: $179.73
- 24-hour low: $167.42
- Total volume: 2,384,876.86 SOL
- Turnover: $418,334,357
Critical SOLUSDT Support and Resistance Levels
The market tested crucial technical levels:
| Level | Price | Significance |
|---|---|---|
| Support Zone | $170-$172 | Key psychological barrier |
| Bearish Engulfing | $170.62 | Confirmed momentum shift |
| Fibonacci 61.8% | $171.83 | Potential rebound level |
Technical Indicators Reveal Oversold Conditions
Key indicators suggest potential reversal opportunities:
- RSI plunged to 28 (oversold territory)
- MACD shows bearish divergence but oversold
- Bollinger Bands broke downward after contraction
Solana Trading Volume Tells the Real Story
The massive 231,509.5 SOL candle at 01:00 ET confirmed strong selling pressure. This volume spike suggests institutional activity or large liquidations.
Where Does SOLUSDT Go From Here?
Traders should watch for:
- Potential bounce from $170 support
- RSI recovery above 30
- Volume patterns on any rebound attempt
The Solana market remains volatile but presents opportunities for alert traders. While the short-term trend is bearish, oversold conditions may trigger a technical rebound.
Frequently Asked Questions
What caused Solana’s price drop?
The sharp decline resulted from technical breakdowns below key moving averages, amplified by high-volume selling pressure around the $170 level.
Is Solana oversold now?
Yes, the RSI at 28 and MACD position suggest SOLUSDT is oversold, which often precedes short-term bounces.
What’s the most important level to watch?
The $168-$170 zone represents critical support. A break below could trigger further downside toward $160.
Could this be a buying opportunity?
Conservative traders might wait for RSI recovery above 30 and confirmation of support holding. Aggressive traders may scale in at current levels with tight stops.


