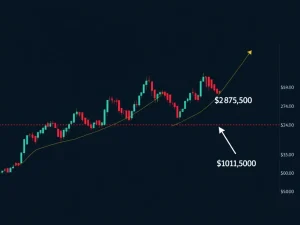
Solana (SOLUSDT) Market Analysis: Decoding Volatility and Trading Opportunities

Solana (SOLUSDT) has been a standout performer in the crypto market, but recent price swings have left traders questioning its next move. In this in-depth analysis, we break down the key technical indicators and market patterns to help you navigate Solana’s volatility with confidence.
Solana Price Action: A Rollercoaster Ride
The SOLUSDT pair experienced significant volatility in the last 24 hours, dropping sharply from $179.4 to $173.69 before rebounding to close near $180.10. This price action tells an important story:
- Strong bearish momentum dominated early trading
- Bullish reversal emerged late in the session
- Volume surged during both selloff and recovery
- RSI showed oversold conditions during the dip
Technical Indicators: What SOLUSDT Charts Reveal
Key technical tools provide valuable insights into Solana’s market structure:
| Indicator | Observation | Implication |
|---|---|---|
| Moving Averages | Price above 20 & 50-period MA | Short-term bullish bias |
| RSI | Rebounded from oversold (30) to 52 | Potential for continued recovery |
| MACD | Positive crossover | Bullish momentum shift |
| Bollinger Bands | Price touched lower then upper band | High volatility period |
Crypto Trading Strategies for SOLUSDT
Based on current market conditions, traders might consider:
- Watch for consolidation near $180 support
- Monitor Fibonacci levels for potential reversals
- Track volume spikes for confirmation of trends
- Set stop-losses below key support at $176
Market Analysis: Where Solana Goes Next
The crypto market remains unpredictable, but Solana shows signs of resilience. The rebound from $170 suggests strong buyer interest, though the longer-term trend remains cautious. Key factors to watch:
- Daily close above $182 could signal continuation
- Sustained volume needed for breakout validity
- Broader crypto market sentiment
Conclusion: Navigating Solana’s Volatility
Solana’s recent price action demonstrates both its potential and risks. While technical indicators suggest short-term bullish momentum, traders should remain vigilant. The crypto market’s inherent volatility means opportunities and risks coexist – the key is disciplined strategy and risk management.
Frequently Asked Questions
What caused Solana’s price drop?
The sharp decline likely resulted from profit-taking after recent gains combined with broader market sentiment shifts.
Is Solana a good buy after this rebound?
Technical indicators suggest potential upside, but always conduct your own analysis and consider risk tolerance before trading.
How reliable are Bollinger Bands for crypto trading?
While useful for identifying volatility extremes, they work best when combined with other indicators in crypto markets.
What’s a reasonable price target for SOLUSDT?
In the short term, $181-182 appears as potential resistance, but targets should adjust with market conditions.
How does Solana’s volume compare to other cryptos?
Solana typically sees strong volume, ranking among top altcoins for liquidity and trading activity.


