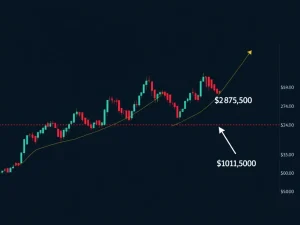
Ripple (XRPUSDT) Market Analysis: Bearish Momentum and Key Support Levels (2025-07-31)

Ripple (XRPUSDT) has been under significant bearish pressure, breaking key support levels. This 24-hour technical summary dives deep into the market trends, indicators, and potential trading opportunities for savvy investors.
Ripple XRPUSDT Price Action: A Bearish Breakdown
The 24-hour trading session for Ripple (XRPUSDT) opened at $3.149, reaching a high of $3.1621 before plunging to a low of $3.0492. The closing price settled at $3.1398, reflecting a clear bearish trend. Key support levels at 3.13–3.14 were breached, signaling potential further downside.
Crypto Market Analysis: Key Technical Indicators
- RSI & MACD: The RSI dipped to ~32, indicating oversold conditions, while the MACD confirmed bearish momentum with a negative histogram.
- Bollinger Bands: Price hovered near the lower band, suggesting heightened volatility and potential for a short-term bounce.
- Volume: Spiked during the selloff, confirming bearish sentiment but tapering off later, hinting at consolidation.
XRP Price Prediction: What’s Next?
Fibonacci retracement levels at 3.11 (38.2%) and 3.13 (61.8%) could act as critical support zones. A break below 3.11 may trigger further declines, while a rebound above 3.15 could signal a short-term reversal. Traders should watch for RSI divergence and volume confirmation.
Cryptocurrency Trading Strategies for XRPUSDT
Given the current technical setup, traders might consider:
- Short-term bounce: Look for oversold RSI conditions and a retest of 3.11–3.13 support.
- Breakout trades: A sustained close above 3.15 could indicate a reversal, while a drop below 3.11 may offer shorting opportunities.
Conclusion: Navigating Ripple’s Volatility
Ripple (XRPUSDT) remains in a bearish phase, but oversold conditions and key Fibonacci levels offer potential trading opportunities. Stay vigilant for volume shifts and reversal patterns to capitalize on market movements.
Frequently Asked Questions (FAQs)
1. What caused the bearish momentum in Ripple (XRPUSDT)?
The breakdown below key support at 3.13–3.14 and increased selling volume drove the bearish trend.
2. Is Ripple (XRPUSDT) oversold?
Yes, the RSI at ~32 suggests oversold conditions, which could lead to a short-term bounce.
3. What are the key support levels for XRPUSDT?
Critical supports lie at 3.11 (38.2% Fib) and 3.13 (61.8% Fib).
4. Should traders consider buying the dip?
Only if RSI and volume confirm a reversal, otherwise, caution is advised due to the prevailing downtrend.


