Ripple (XRPUSDT) Surges: Bullish Breakout and Key Trading Signals You Can’t Ignore
Ripple (XRPUSDT) has shown remarkable strength in the last 24 hours, breaking key resistance levels and forming a bullish engulfing pattern. For traders and investors, this signals a potential shift in momentum. Let’s dive into the details of this exciting development.
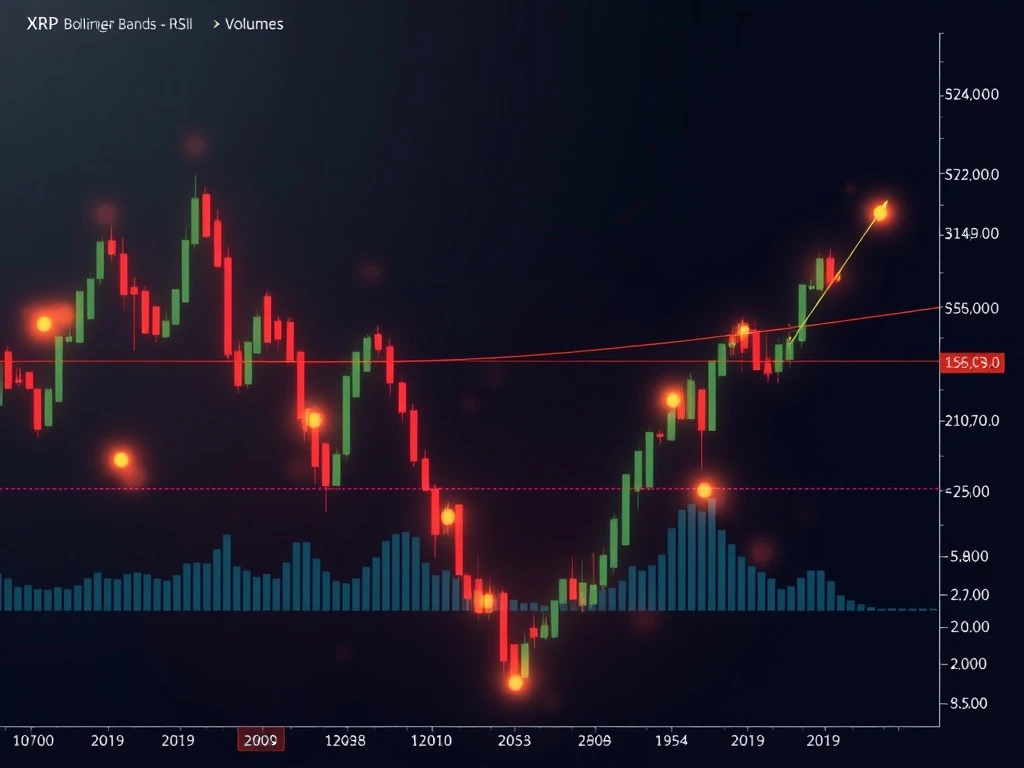
Ripple XRPUSDT: Key Price Movements
Ripple (XRPUSDT) traded between $3.0533 and $3.1624, closing at $3.1276. The late-day rally pushed the price above critical resistance, supported by a significant volume spike. Here’s what stood out:
- Bullish engulfing pattern near $3.12–$3.13, indicating a short-term reversal.
- Volume surge in the final 6 hours, confirming accumulation.
- RSI approaching 65, nearing overbought territory but still supportive of upward momentum.
Technical Indicators: RSI and Bollinger Bands Signal Strength
The RSI and MACD both show upward momentum, while Bollinger Bands widened, reflecting increased volatility. Key observations:
- RSI at 66 suggests caution but not yet overbought.
- Bollinger Bands expansion indicates a breakout, with price pushing above the upper band.
- Golden cross on the 15-minute chart (50-period MA crossing above 20-period MA) reinforces bullish bias.
Fibonacci Retracement: Strong Support at Key Levels
Applying Fibonacci levels to the latest swing, XRPUSDT found support at the 61.8% retracement ($3.128) before pushing higher. This aligns with the bullish engulfing pattern and suggests continued upside potential.
What’s Next for Ripple XRPUSDT?
Traders should watch for:
- Test of $3.15–$3.16 as the next resistance zone.
- Pullback to $3.12–$3.13 for potential entry points.
- RSI levels—if it crosses 70, a short-term correction may follow.
FAQs
1. What does the bullish engulfing pattern mean for XRPUSDT?
It signals a potential reversal from bearish to bullish sentiment, especially when confirmed by rising volume.
2. Is Ripple (XRPUSDT) overbought?
The RSI at 66 suggests it’s nearing overbought territory, but not yet at extreme levels. Caution is advised for aggressive longs.
3. How significant is the golden cross on the 15-minute chart?
It’s a short-term bullish signal, indicating that the 50-period MA has crossed above the 20-period MA, supporting upward momentum.
4. What should traders watch in the next 24 hours?
Key levels include $3.15–$3.16 resistance and $3.12–$3.13 support. Volume and RSI will also be critical for confirming trends.