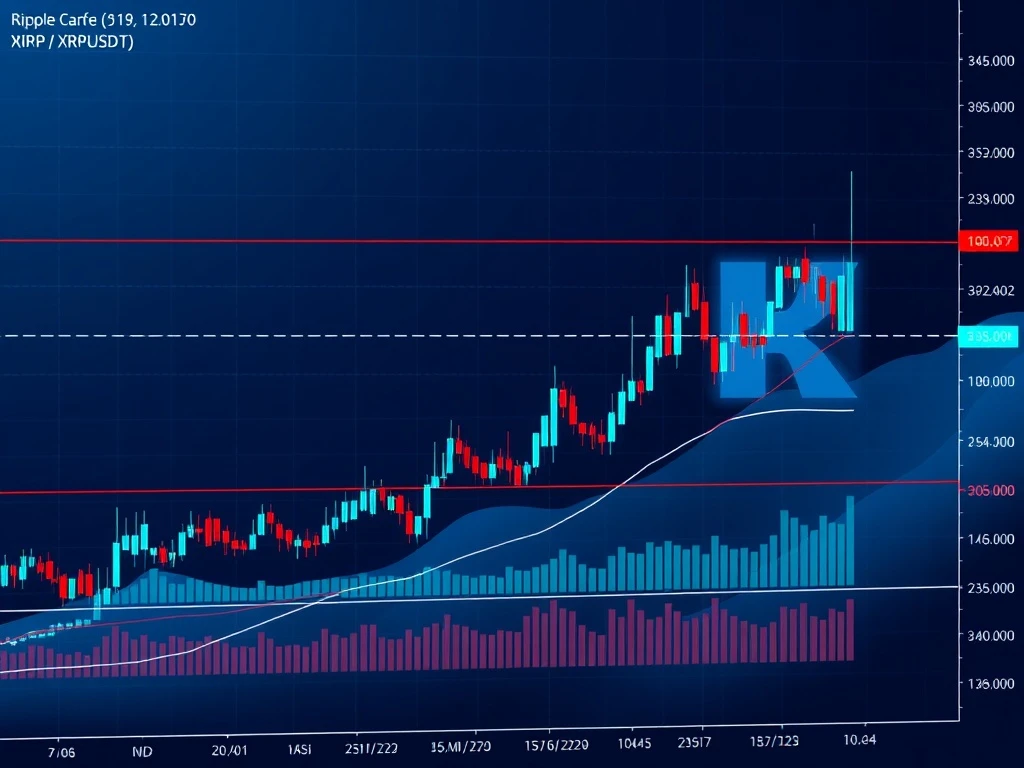
Ripple XRP: Unveiling Crucial Insights from 24-Hour Technical Analysis

Are you tracking the dynamic world of cryptocurrencies? For traders and investors alike, understanding the daily pulse of assets like Ripple XRP is essential. The past 24 hours for XRPUSDT have been a testament to the volatility and complex price action that defines the crypto market. Let’s delve into a comprehensive technical summary, dissecting the movements, indicators, and what they might signal for this prominent digital asset.
Understanding the XRPUSDT 24-Hour Rollercoaster
The XRPUSDT pair experienced a significant 24-hour trading period, opening at $3.1821 on July 26, 2025, at 12:00 ET. Throughout the day, it navigated a volatile range, reaching a high of $3.2356 and a low of $3.1637, before settling near its opening price at $3.1867 by July 27, 2025, 12:00 ET. This seemingly small net change masks considerable intraday movements.
Total 24-hour volume for Ripple XRP amounted to 71,315,138.9 XRP, translating to a notional turnover of approximately $226.4 million. This volume indicates substantial trading interest within the observed price range. The 24-hour chart revealed a sharp midday rally, which was subsequently followed by a consolidation phase. The market is clearly at a juncture, testing significant support and resistance levels.
Key Price Points and Volume Dynamics:
- Price Range: $3.1637 (low) to $3.2356 (high).
- Closing Price: $3.1867.
- Volume: Over 71 million XRP traded, signaling active participation.
- Midday Surge: A notable volume spike accompanied the midday rally, suggesting strong buying pressure at that time.
Decoding XRP Price Analysis: Key Levels and Candlestick Insights
For effective XRP price analysis, understanding structural formations and key support and resistance levels is paramount. The recent 24-hour period provided several insights into where buying and selling interest resides.
Strong support levels were observed and reinforced around $3.17 and $3.18. These zones repeatedly held the price during pullbacks, indicating potential demand at these thresholds. Conversely, resistance was met around the $3.20–$3.21 region, where upward movements tended to stall.
Candlestick Patterns Tell a Story:
- Bullish Engulfing: An early morning bullish engulfing pattern around $3.17–$3.18 suggested renewed buying interest, setting the stage for the midday rally.
- Bearish Engulfing: Several bearish engulfing patterns emerged during the afternoon sell-off, confirming increased selling pressure as the rally faded.
- Doji: A doji formed near $3.21 in the afternoon. This particular candlestick pattern signifies indecision in the market, often preceding a reversal or a period of consolidation as buyers and sellers reach an equilibrium.
Navigating the Waters with Cryptocurrency Technical Analysis Tools
Beyond raw price action, cryptocurrency technical analysis relies on a suite of indicators to gauge momentum, volatility, and potential future direction. Let’s examine what key tools revealed about Ripple XRP‘s recent performance.
Moving Averages: Shifting Momentum
On the 15-minute chart, the 20-period and 50-period moving averages (MAs) crossed over twice, reflecting the rapid shifts in intraday momentum. Initially, the 50-period MA remained above the 20-period MA in the morning, indicating a short-term bullish bias. However, this flipped in the afternoon, with the 20-period MA crossing below the 50-period MA, signaling a bearish turn. On the daily chart, the price closed below the 50-period MA but remained above the 100-period MA, suggesting a mixed sentiment in the broader context.
MACD & RSI: Momentum and Overbought/Oversold Signals
- MACD (Moving Average Convergence Divergence): The MACD crossed into positive territory during the midday rally, confirming the upward momentum. However, it quickly turned negative in the afternoon, aligning with the bearish price action. This confirms a shift in short-term momentum from bullish to bearish.
- RSI (Relative Strength Index): The RSI reached overbought territory during the rally, indicating that the price rise was perhaps unsustainable in the short term. As the afternoon progressed, the RSI fell below 50, suggesting that selling pressure increased and a potential short-term bottom might be forming. A divergence between RSI and price action in the afternoon, where price continued to fall but RSI showed signs of stabilizing or even rising slightly, advises caution and could hint at a weakening downtrend or an impending reversal.
Bollinger Bands: Volatility Insights
Bollinger Bands showed moderate volatility for XRPUSDT, with a width of approximately 0.03. Price oscillated primarily between the upper and lower bands throughout the day, briefly touching the upper band during the midday high. A contraction in the bands was noted in the early morning, often a precursor to a significant price move, which was followed by an expansion during the rally. This expansion confirmed the increase in volatility during the bullish surge.
Fibonacci Retracements: Pinpointing Key Zones
Applying Fibonacci retracements from the swing high at $3.2356 to the low at $3.1637 reveals crucial levels. The 38.2% and 61.8% retracement levels aligned with $3.20 and $3.18 respectively. Price found temporary support at both these levels during the session, reinforcing their significance. These Fibonacci levels are likely to serve as key zones for traders to watch in the upcoming 24 hours, acting as potential support or resistance points.
What Does This XRP Market Overview Tell Us About the Future?
The recent XRP market overview paints a picture of consolidation and indecision. While Ripple XRP demonstrated a strong midday rally, the subsequent retracement and the behavior of technical indicators suggest a period of cautious trading ahead. The price found itself caught between established support at $3.17 and resistance at $3.21.
Investors should remain vigilant. The divergence observed in momentum indicators, coupled with declining volume during the afternoon’s price movement, suggests potential exhaustion from both buyers and sellers. This often precedes a significant directional move. A decisive break above $3.21 could signal renewed bullish momentum, potentially targeting higher resistance levels. Conversely, a clear break below $3.17 could trigger increased selling pressure, pushing XRP towards lower support zones.
The market appears to be in a waiting game, absorbing recent movements and building energy for its next significant move. Traders should closely monitor these key levels and confirm any breakouts or breakdowns with sustained volume.
Conclusion: Navigating XRP’s Next Move
The last 24 hours for Ripple XRP on the XRPUSDT pair have provided a wealth of data for cryptocurrency technical analysis. From volatile price swings and significant volume surges to the intricate signals from MACD, RSI, Moving Averages, and Bollinger Bands, the market showcased both bullish potential and bearish corrections. The consolidation phase around key Fibonacci levels suggests a period of equilibrium before the next directional shift. As we look forward, the ability of XRP to hold above $3.17 or break past $3.21 will be critical in determining its short-term trajectory. Stay informed, remain cautious, and let the charts guide your next steps in the exciting world of crypto.
Frequently Asked Questions (FAQs)
Q1: What was the trading range for XRPUSDT in the last 24 hours?
A1: The XRPUSDT pair traded in a range between a low of $3.1637 and a high of $3.2356 during the observed 24-hour period.
Q2: What did the volume patterns indicate for Ripple XRP?
A2: Volume surged significantly during the midday rally, indicating strong buying interest. However, it declined in the afternoon despite continued price movement, suggesting potential exhaustion or lack of conviction in the subsequent downtrend.
Q3: How did technical indicators like MACD and RSI signal market momentum?
A3: The MACD turned positive during the rally but quickly became negative in the afternoon, confirming a bearish shift. The RSI reached overbought levels during the rally and then fell below 50, suggesting increased selling pressure and a potential short-term bottom forming. Divergence between RSI and price indicated caution.
Q4: What are the key support and resistance levels for XRPUSDT to watch?
A4: Key support levels were reinforced around $3.17 and $3.18. Resistance was observed at $3.20–$3.21, aligning with Fibonacci retracement levels. These zones are crucial for future price action.
Q5: What does the Bollinger Bands analysis suggest about XRP’s volatility?
A5: Bollinger Bands indicated moderate volatility, with the price oscillating between the bands. A contraction followed by an expansion confirmed the increase in volatility during the midday rally, suggesting active price discovery.
Q6: What is the forward-looking view for Ripple XRP based on this analysis?
A6: XRP/USDT is likely to continue consolidating between $3.17 and $3.21. A decisive break above $3.21 or below $3.17, confirmed by volume, could trigger a significant directional move. Investors should remain cautious due to mixed signals from indicators.


