Neiro Ethereum (NEIROUSDT) Price Analysis: Bearish Signals Dominate Market Trends

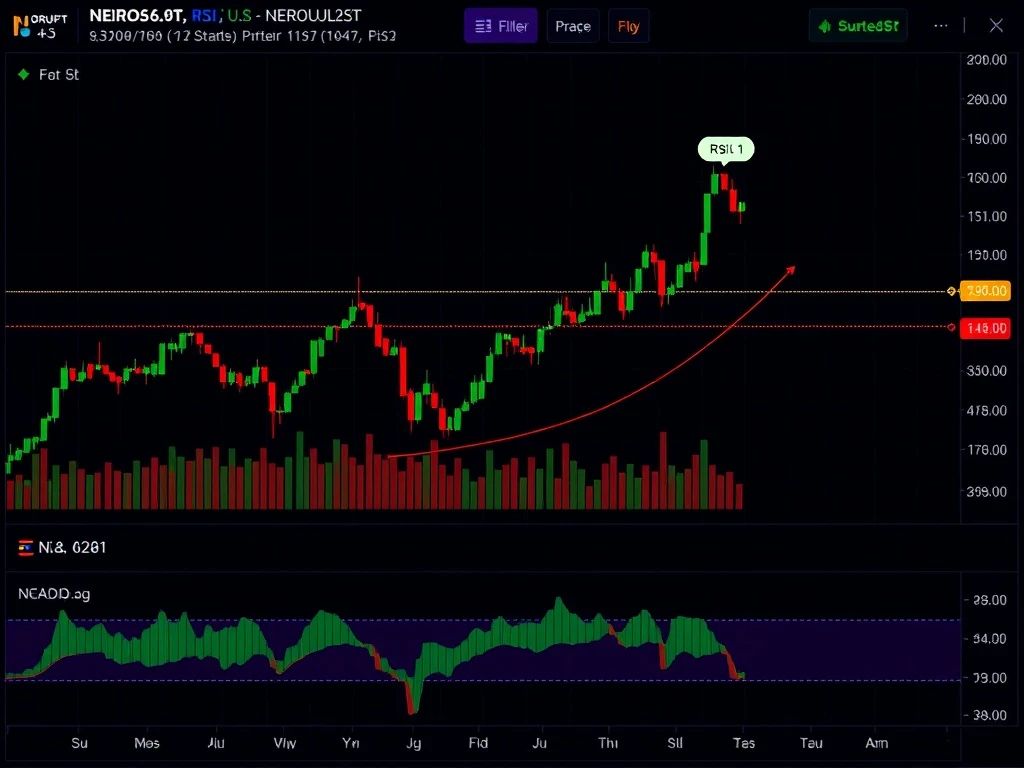
Neiro Ethereum (NEIROUSDT) has shown significant volatility in the past 24 hours, with bearish signals dominating the market. This analysis dives deep into the price action, technical indicators, and potential trading strategies for crypto enthusiasts.
Neiro Ethereum 24-Hour Price Action
NEIROUSDT opened at 0.00045008, reaching a high of 0.00045368 before closing at 0.00043764. The session low was 0.00042046, marking a 6.3% decline. Key observations:
- Total volume: 18,859,226,084.0
- Notional turnover: ~$8,551,786
- Bearish breakdown from consolidation range
Technical Indicators: What Do They Reveal?
The crypto trading landscape for NEIROUSDT shows several concerning signals:
| Indicator | Observation |
|---|---|
| RSI | Bearish divergence, dipped to 30-35 |
| MACD | Turned negative after brief positive divergence |
| Bollinger Bands | Expanded sharply, price near lower band |
Market Trends and Key Levels to Watch
The current market analysis suggests:
- Strong resistance at 20-period MA (0.000441)
- Critical support at 0.000430 and 0.000425
- 61.8% Fibonacci retracement at 0.00043764
Crypto Trading Strategies for NEIROUSDT
Given the bearish technical analysis, traders might consider:
- Short positions below 0.000430
- Stop-loss above 0.000441
- Watch for RSI divergence for potential reversals
Conclusion: Navigating the Bearish Tide
While short-term bounces may occur, the overall trend for Neiro Ethereum remains bearish. Crypto traders should exercise caution and monitor key levels closely. The market could see further downside if support at 0.000430 breaks.
Frequently Asked Questions
Q: What caused the recent NEIROUSDT price drop?
A: The decline was driven by bearish technical signals including RSI divergence and failed bullish patterns.
Q: Is now a good time to buy NEIROUSDT?
A: Current technical analysis suggests caution. Wait for confirmation of support holding or trend reversal signals.
Q: What are the key resistance levels for NEIROUSDT?
A: Immediate resistance is at 0.000441 (20-period MA), with stronger resistance at the day’s high of 0.00045368.
Q: How reliable are these technical indicators for crypto trading?
A: While useful, technical analysis should be combined with other factors. Crypto markets can be highly volatile.


