Neiro Ethereum (NEIROUSDT) Market Analysis: Key Trends and Trading Insights

Wondering how Neiro Ethereum (NEIROUSDT) performed in the last 24 hours? Dive into this comprehensive market analysis to uncover key trends, support levels, and trading opportunities in this volatile crypto pair.
Neiro Ethereum Price Action: A Rollercoaster Ride
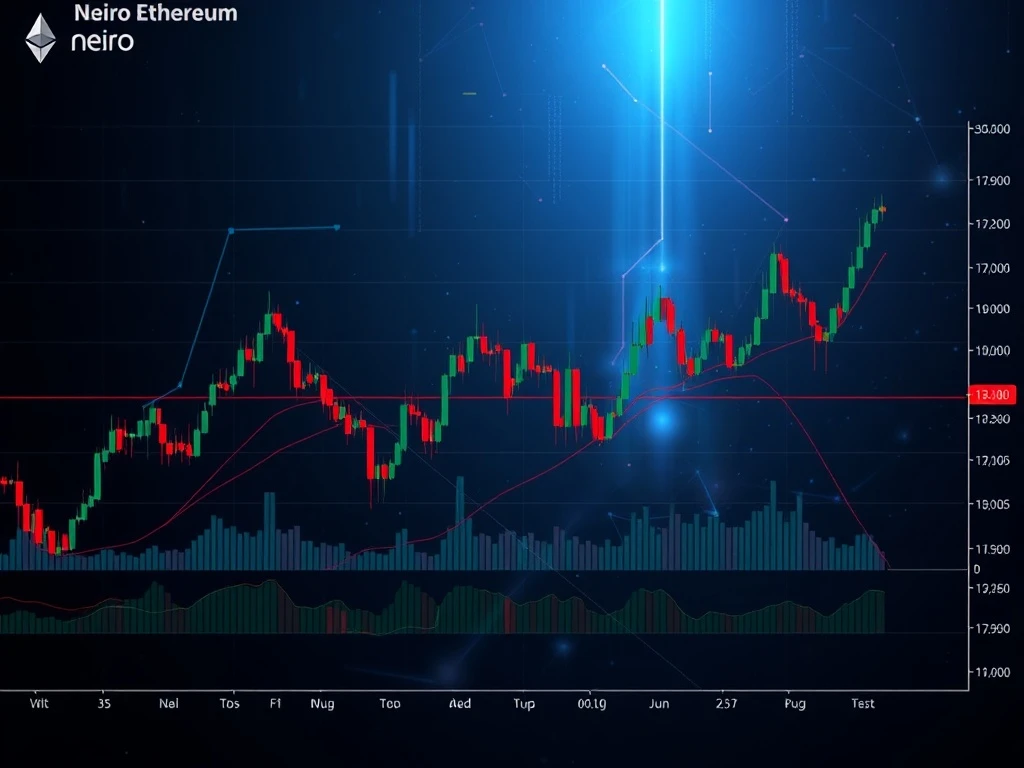
The NEIROUSDT pair experienced significant volatility, closing lower at 0.0004089 after sharp intraday swings. Key developments include:
- Price broke below crucial support at 0.0004200
- Bearish patterns emerged (engulfing and dark cloud cover)
- Volume surged during breakdowns, confirming bearish momentum
- RSI dipped into oversold territory, hinting at potential rebound
Crypto Trading Signals: Technical Indicators Breakdown
Technical analysis reveals important insights for traders:
| Indicator | Observation | Implication |
|---|---|---|
| Moving Averages | Price below 20, 50, and 200 MA | Strong bearish trend |
| MACD | Signal line below zero | Bearish momentum |
| Bollinger Bands | Price near lower band | High volatility, potential reversal |
Ethereum Market Analysis: Key Levels to Watch
Fibonacci retracement levels from the 0.00043033 high are critical:
- 38.2% at 0.0004219 (resistance)
- 61.8% at 0.00041634 (support)
- 78.6% at 0.0004097 (next support)
These levels will determine near-term price direction for NEIROUSDT.
Market Trends: Volume and Volatility Insights
The 24-hour session saw:
- Total volume of 8,824,126,490.0
- Notional turnover of $3,695,629.00
- Volatility expansion in early ET hours
- Volume spikes during key breakdowns
Trading Strategy: Navigating NEIROUSDT Movements
For traders considering positions:
- Watch for RSI divergence signaling potential reversals
- Monitor volume trends for confirmation of moves
- Consider Fibonacci levels for entry/exit points
- Be cautious of potential oversold bounce
FAQs: Neiro Ethereum (NEIROUSDT) Trading
Q: What caused the NEIROUSDT price drop?
A: The drop resulted from breaking key support at 0.0004200, confirmed by bearish chart patterns and high-volume selling pressure.
Q: Is NEIROUSDT oversold now?
A: RSI below 30 suggests oversold conditions, but this doesn’t guarantee an immediate reversal – it may indicate short-term bounce potential.
Q: What’s the most important level to watch now?
A: The 61.8% Fibonacci level at 0.00041634 is critical – holding as support could stabilize price, while breaking lower may extend declines.
Q: How does this compare to broader Ethereum market trends?
A: NEIROUSDT movements often correlate with ETH trends but can show unique volatility due to its specific pairing dynamics.


