Neiro Ethereum (NEIROUSDT) Surges: 24-Hour Market Analysis & Trading Insights

Neiro Ethereum (NEIROUSDT) has captured traders’ attention with its recent price surge and volatility. In this 24-hour market analysis, we break down the key trends, technical indicators, and trading opportunities for this emerging Ethereum-based altcoin.
Neiro Ethereum Price Action: Bullish Reversal in Play
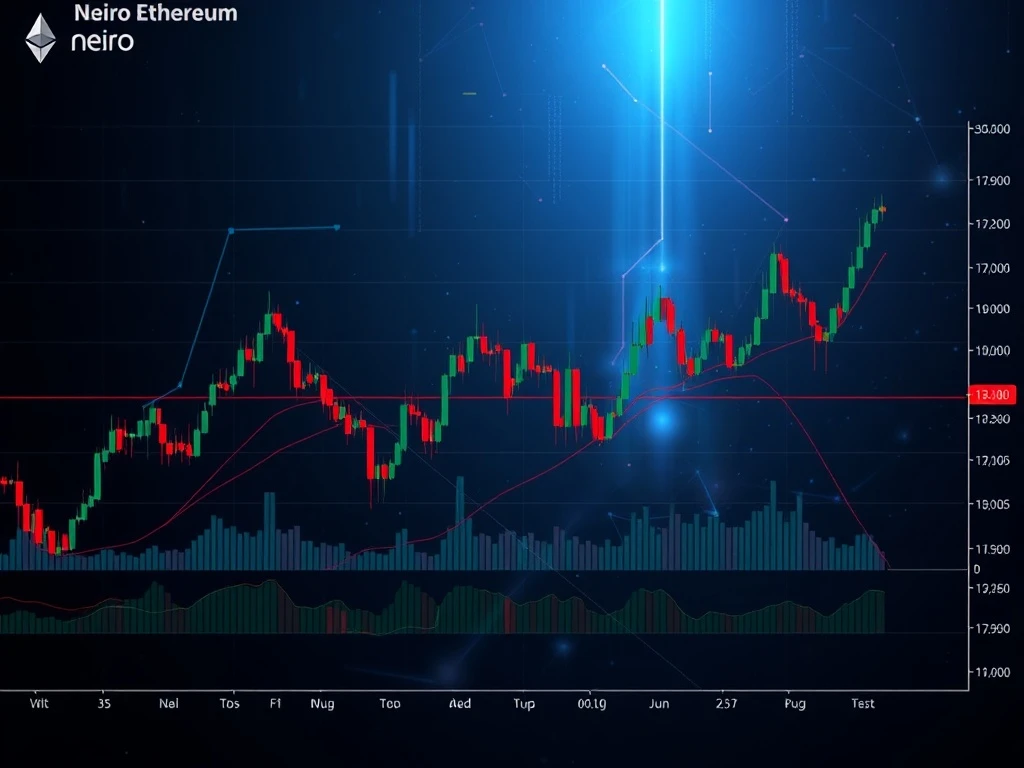
The NEIROUSDT pair showed strong momentum, opening at 0.0004089 and reaching a high of 0.00043959 before closing at 0.00042176. Key observations:
- Bullish engulfing pattern formed around 06:30–06:45 ET
- Resistance tested at 0.00043823 multiple times
- Support held firm at 0.00042037
Crypto Trading Indicators: What Technicals Reveal
Technical analysis shows mixed signals for NEIROUSDT:
| Indicator | Observation |
|---|---|
| RSI | Overbought at 70+, suggesting potential pullback |
| MACD | Bullish crossover confirmed |
| Bollinger Bands | Price testing upper band, indicating stretched momentum |
Ethereum Altcoin Volume and Market Activity
The 24-hour volume reached 8.278 billion NEIRO with $3.55 million in turnover. Notable volume spikes:
- 761 million NEIRO traded during peak rally
- Volume divergence appearing at price peaks
- Declining volume suggests waning momentum
Market Analysis: Key Levels to Watch
Fibonacci retracement levels from the recent swing:
- 38.2% at 0.0004276 (support)
- 61.8% at 0.0004331 (current consolidation zone)
- Resistance at 0.00043823 remains critical
Forward-Looking View for NEIROUSDT
While the short-term trend appears bullish, traders should watch for:
- RSI cooling from overbought territory
- Volume confirmation on breakout attempts
- Potential retest of 0.00042037 support
This Ethereum-based altcoin shows promise but requires careful risk management given the current technical setup.
Frequently Asked Questions
What is Neiro Ethereum (NEIROUSDT)?
Neiro Ethereum is an ERC-20 token traded against Tether (USDT) on various cryptocurrency exchanges.
Why did NEIROUSDT price surge recently?
The price rally was accompanied by high volume, suggesting strong buying interest, though technical indicators now show overbought conditions.
What are the key support levels for NEIROUSDT?
Immediate support lies at 0.0004276 (38.2% Fib) with stronger support at 0.00042037.
Is now a good time to buy NEIROUSDT?
Traders should wait for either a confirmed breakout above resistance or a pullback to support with volume confirmation.
What technical indicators are most relevant for NEIROUSDT?
RSI, MACD, and Bollinger Bands are currently providing the clearest signals, along with volume analysis.


