Mantle Price Prediction: MNT Unleashes Explosive 73.8% Gains Targeting $1.30

Are you ready for the next big move in the crypto market? Mantle (MNT) has just made a significant splash, shattering a crucial resistance level and setting its sights on an impressive 73.8% climb. For investors and traders keenly watching the altcoin space, this breakout could signal the start of a thrilling new chapter for MNT. Let’s dive into the technical indicators that suggest Mantle is poised for substantial gains.
Mantle (MNT) Breaks Key Resistance: What It Means
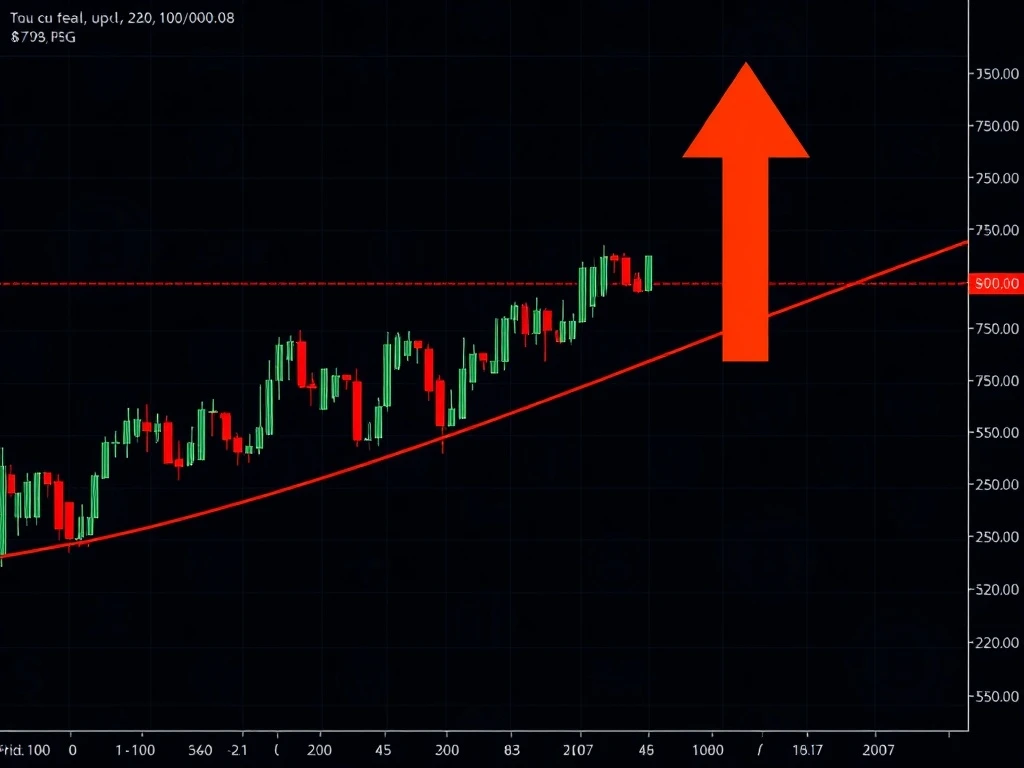
Mantle (MNT) has been a token of keen interest for technical analysts, and its recent price action has delivered a clear bullish signal. The token decisively surged past the $0.77 mark, a pivotal Fibonacci retracement zone that had previously acted as a strong ceiling. This breakthrough comes after months of consolidation within a distinctive descending broadening wedge pattern, a formation often indicative of a strong continuation move.
- Significant Breakout: Mid-July saw steep upward candlesticks confirm the breach of the $0.77 resistance.
- Volume Confirmation: The breakout was accompanied by a notable increase in trading volume, lending credibility to the move and suggesting robust buyer interest.
- Historical Context: MNT’s journey from a base near $0.55 to the $0.75 range in a short period underscores the pattern’s reliability.
This confluence of factors paints a compelling picture for Mantle, suggesting that the recent price surge is not merely a fleeting spike but a validated shift in market dynamics.
Decoding the Descending Broadening Wedge Pattern
The descending broadening wedge is a powerful chart pattern, particularly relevant to understanding the recent MNT technical analysis. Characterized by diverging trendlines that broaden as the price moves lower, it often resolves with a strong upward breakout. For Mantle, this pattern formed over a four-month base starting in April, progressively tightening before the mid-July surge.
The structural integrity of this wedge is crucial. Its width and angle provide a clear trajectory for the token’s potential measured move. The upper horizontal resistance of the pattern has now been breached, creating a strong technical foundation for continued upward momentum. This pattern’s resolution is a key driver behind the optimistic MNT price prediction.
Targeting the Horizon: Mantle Price Prediction to $1.30
With the $0.77 resistance firmly behind it, analysts are now setting their sights on ambitious targets for Mantle (MNT). Fibonacci extensions, a common tool in technical analysis, project several potential levels for bulls to monitor:
- First Checkpoint: $0.99
- Intermediate Target: $1.11
- Primary Target: $1.30
These levels are not arbitrary; they represent confluence zones where historical price action and Fibonacci tools align, providing strong indicators for future price movements. While prior resistance around $0.86 (established in April and June) may act as intermediate tests, a clean break above $0.90 could significantly accelerate the move towards these higher targets.
The path to $1.30 will likely require a second leg of strong price action to confirm the breakout’s strength and sustainability. Sustained volume spikes and consistent candle closes above $0.77 will be key indicators for traders looking to capitalize on this potential rally.
Navigating the Path: Short-Term Support and Market Conditions
While the outlook for Mantle is overwhelmingly bullish, maintaining short-term support levels is critical for the continuation of this upward trend. Traders will be closely monitoring key Fibonacci levels for consolidation:
- Immediate Support: The 0.618 Fibonacci level at $0.72.
- Secondary Support: The 0.5 Fibonacci level at $0.68.
A failure to hold these levels could trigger a retracement, potentially challenging the validity of the recent crypto resistance break. Conversely, sustained trading volume and strong candlestick closes above the $0.77 mark would further reinforce the case for continued gains, signaling strong institutional and retail participation.
It’s important to remember that while technical indicators provide a robust framework, broader market conditions and macroeconomic factors can always influence outcomes. However, the current on-chain and chart-based indicators for Mantle paint a decidedly optimistic picture.
What Should Traders Monitor for Mantle’s Continued Ascent?
For those looking to engage with Mantle’s promising trajectory, immediate focus should remain on volume and candlestick behavior. Steep, high-volume candles closing decisively above key resistance levels would be a strong signal of sustained momentum. The structural integrity of the wedge, combined with the current bullish price action, offers a clear trajectory for the token. However, price action consistently above $0.90 and then $1.10 will ultimately determine the sustainability of the move towards the ambitious $1.30 target.
The confluence of technical factors, including the breakout from the descending broadening wedge and the breach of significant Fibonacci resistance, positions MNT for a potential measured move to $1.30. This target aligns both with the projected width of the wedge and the calculated Fibonacci extensions, offering a compelling outlook for Mantle in the coming period.
Frequently Asked Questions (FAQs)
Q1: What is Mantle (MNT)?
Mantle (MNT) is the native token of the Mantle Network, a high-performance Ethereum Layer 2 scaling solution. It plays a crucial role in the ecosystem for governance, staking, and gas fees, making it an integral part of a growing blockchain infrastructure.
Q2: What caused Mantle’s recent price surge?
Mantle’s recent price surge is primarily attributed to a significant technical breakout. It successfully breached the key $0.77 resistance level after consolidating within a bullish descending broadening wedge pattern. This breakout was confirmed by increased trading volume and strong upward candlesticks, signaling renewed buyer interest.
Q3: What are the key resistance and support levels for MNT?
The primary resistance that Mantle recently broke was at $0.77. Looking ahead, potential resistance levels include $0.86, $0.99, and $1.11, with the ultimate target being $1.30. Key short-term support levels to monitor are the 0.618 Fibonacci level at $0.72 and the 0.5 Fibonacci level at $0.68.
Q4: What is a descending broadening wedge pattern?
A descending broadening wedge is a bullish chart pattern characterized by two diverging trendlines that widen as the price moves lower. It typically signals that bearish momentum is waning, and a strong upward breakout is likely once the price breaks above the upper trendline, as seen with Mantle (MNT).
Q5: Is the $1.30 target guaranteed for Mantle?
While technical analysis, including Fibonacci extensions and pattern measurements, projects a target of $1.30, no price target in financial markets is guaranteed. The path to $1.30 will require sustained bullish momentum, continued high volume, and the ability to hold key support levels. Broader market conditions and external factors can also influence the outcome.
Q6: What should traders monitor for MNT’s continued momentum?
Traders should closely monitor trading volume, ensuring it remains high during upward movements. Consistent closes above the $0.77 level and subsequent breaks above $0.90 and $1.10 would further confirm the strength of the breakout. Holding the short-term support levels at $0.72 and $0.68 is also crucial for maintaining the bullish trend.


