Liquidation Heatmaps: The Game-Changer for Managing Crypto Leveraged Position Risks
In the high-stakes world of cryptocurrency trading, liquidation heatmaps and charts have emerged as indispensable tools for managing leveraged position risks. These powerful visual aids help traders navigate volatile markets, avoid forced liquidations, and make informed decisions. But how exactly do they work, and why are they so critical for crypto derivatives traders?
What Are Liquidation Heatmaps and Why Do They Matter?
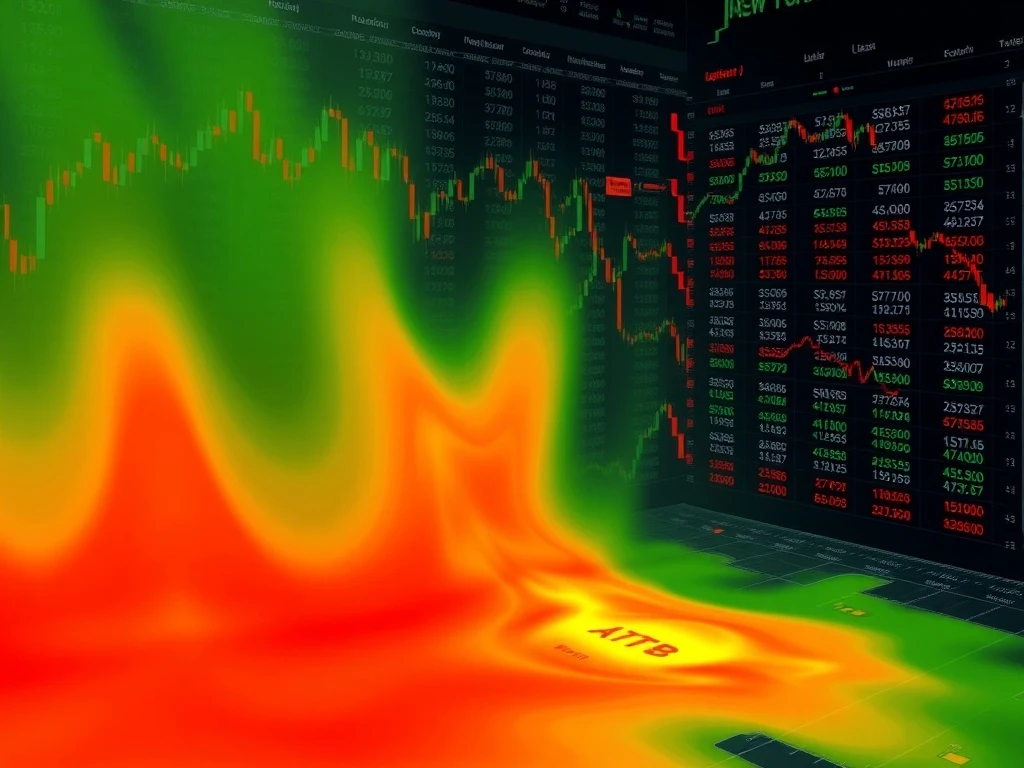
Liquidation heatmaps provide a visual representation of price zones where leveraged positions are concentrated. These tools use color-coding to highlight areas of high risk (red/orange) and low risk (yellow/green). Key benefits include:
- Identifying potential support/resistance levels
- Anticipating market volatility
- Spotting clusters of long or short positions
- Avoiding areas prone to cascading liquidations
How Crypto Leveraged Positions Work and the Risks Involved
In crypto derivatives markets, liquidation occurs when a trader’s margin falls below the required threshold. This triggers automatic position closure to prevent further losses. The process involves:
- Price movements eroding collateral
- Exchange executing forced closures
- Potential slippage and additional fees
- Significant losses during extreme volatility
Using Liquidation Charts for Smarter Risk Management
While heatmaps show position concentrations, liquidation charts track historical events over time. These charts feature:
| Element | Meaning |
|---|---|
| Red bars | Long liquidations (price drops) |
| Green bars | Short liquidations (price rallies) |
| Bar height | Volume of liquidations |
Top Platforms Offering Advanced Liquidation Tools
Leading platforms like Coinglass and CoinAnk provide sophisticated heatmap functionalities including:
- Real-time liquidation risk assessment
- Leverage ratio integration
- Color-coded intensity indicators
- Historical data analysis
Actionable Strategies for Leveraged Crypto Traders
Smart traders use liquidation tools to:
- Avoid entering positions near high-risk clusters
- Time entries after market manipulation events
- Identify whale behavior and sentiment shifts
- Capitalize on post-liquidation rebounds
As crypto derivatives markets continue evolving, liquidation heatmaps and charts remain vital for preserving capital and navigating volatility. These tools provide the edge needed to survive and thrive in the high-risk world of leveraged crypto trading.
Frequently Asked Questions
What exactly triggers a liquidation in crypto trading?
Liquidation occurs when a trader’s margin balance falls below the required maintenance margin level, forcing automatic position closure by the exchange.
How often should I check liquidation heatmaps?
Active traders should monitor heatmaps in real-time, while casual traders should check them before entering any leveraged position.
Can liquidation heatmaps predict exact price movements?
No, they indicate potential risk zones rather than precise predictions, helping traders make more informed decisions.
Are these tools useful for spot trading?
While primarily designed for derivatives, they can provide valuable insights into overall market sentiment and potential turning points.
Do all exchanges provide liquidation data?
No, third-party platforms like Coinglass aggregate data from multiple exchanges to provide comprehensive heatmaps.


