Injective (INJ) Price Explodes: Harmonic Pattern Unveils 27% Crypto Upside Potential
Are you tracking the latest movements in the crypto market, especially the promising DeFi sector? If so, you’ve likely noticed the impressive performance of Injective (INJ) recently. This powerful DeFi token has been making waves, and a closer look at its chart reveals some fascinating technical signals. Let’s dive into why Injective price is grabbing headlines and what a specific harmonic pattern could mean for its future trajectory.
Understanding the Recent Injective (INJ) Price Surge
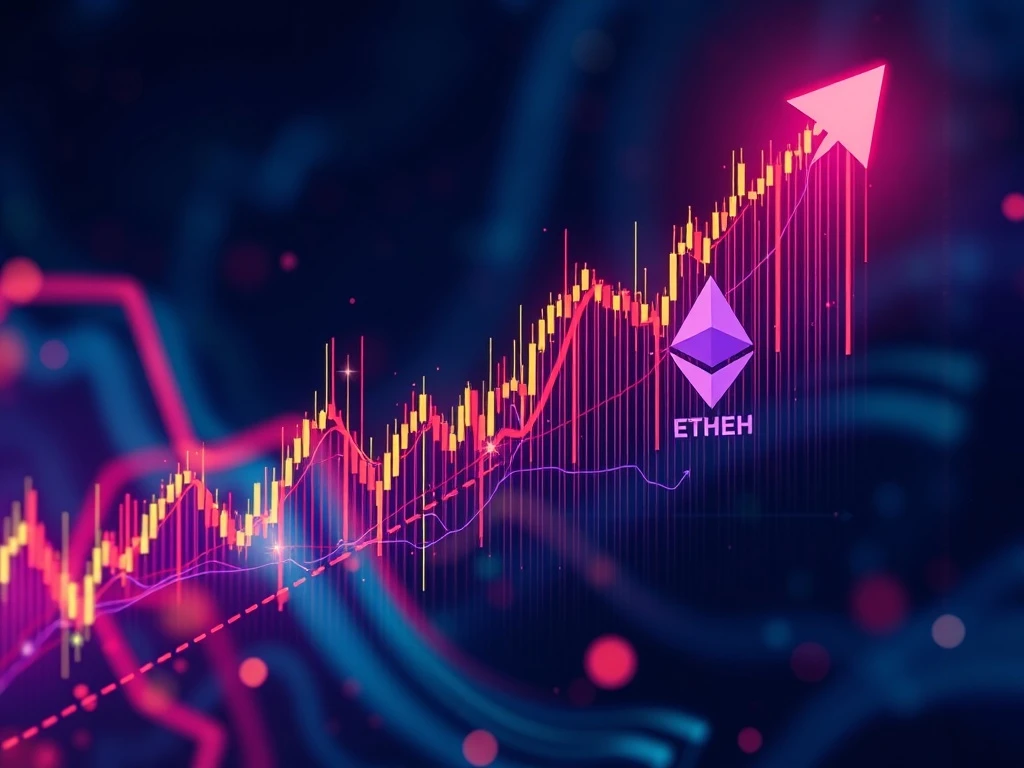
Injective (INJ) has truly caught the attention of investors, recording a significant 7% surge on July 26, 2025, and extending its monthly gains to an impressive 26%. This robust upward momentum isn’t happening in isolation; it aligns perfectly with a broader wave of bullish sentiment sweeping across the cryptocurrency market. Notably, Ethereum (ETH), a major bellwether for the altcoin space, also climbed over 3% on the same day, contributing to the positive atmosphere.
But what’s truly exciting analysts about Injective’s recent move? It’s the emergence of a distinctive harmonic pattern on its price chart. This technical setup often provides clues about potential future price movements, and for INJ, it’s hinting at a substantial 27% upside. The ability of the Injective price to bounce decisively from key support levels, such as the 200-day moving average, underscores the underlying buying interest and reinforces the validity of these technical signals.
Decoding the Harmonic Pattern Analysis for INJ
For those new to technical analysis, a harmonic pattern is a price formation that adheres to specific Fibonacci ratios, often used to predict trend continuations or reversals. In Injective’s case, analysts have identified a bearish ABCD harmonic pattern. While the term “bearish” might sound alarming, in the context of an ABCD pattern forming during an uptrend, it often signals a potential continuation of the current bullish momentum after a correction, or a target for a move. Let’s break down its components:
- Point A to B: The Initial Rally (April to Early June): INJ began its ascent from $6.30 (Point A) to reach $13.80 (Point B). This leg established the initial bullish impulse.
- Point B to C: The Correction (Late June): Following the rally, INJ experienced a pullback, dipping to $8.98 (Point C). This correction is a natural part of a healthy market cycle, allowing for profit-taking and new entry points.
- Point C to D: The Resurgence (Current Phase): From Point C, Injective has resumed its upward trajectory, currently positioned near $14.23. This is the final leg of the pattern, where the price aims to reach a specific Fibonacci extension level.
The significance of this particular Harmonic Pattern Analysis lies in its potential to project future price targets. The pattern suggests a potential target at the 1.41 Fibonacci extension level, which translates to approximately $18.10. This projection represents a compelling 27% increase from current levels, provided the token sustains its buying momentum and remains above critical support levels.
The Critical Role of the 200-Day Moving Average
One of the most crucial elements supporting the bullish outlook for Injective is its recent interaction with the 200-day moving average (200-DMA). This widely followed technical indicator acts as a significant long-term support or resistance level. For INJ, the price recently bounced emphatically from the 200-DMA at $12.77. This isn’t just a random bounce; historically, this level has often served as a robust floor for the asset, preventing deeper pullbacks and signaling strong underlying demand.
Holding above the 200-DMA is paramount for the validity of the harmonic pattern and the continuation of the bullish trend. It suggests that despite minor fluctuations, the long-term trend remains upward. Traders and investors often view a sustained presence above the 200-DMA as a strong indicator of market strength and a positive sign for continued growth. Monitoring this level closely will be key for anyone following the Injective price action.
How Does Ethereum Market Impact Influence INJ’s Trajectory?
The cryptocurrency market is highly interconnected, and the performance of major assets often dictates the broader sentiment. Injective’s rally is not occurring in isolation; it aligns with a broader “risk-on” sentiment that has recently taken hold in the crypto space. A significant contributor to this positive shift is the recent gains seen in Ethereum (ETH).
As the second-largest cryptocurrency by market capitalization and the backbone of countless DeFi projects, Ethereum’s health often cascades across the altcoin ecosystem. When Ethereum news indicates strength and positive momentum, it tends to instill confidence in investors, leading them to deploy capital into other promising altcoins, particularly those within the DeFi sector like Injective. This symbiotic relationship means that continued strength in ETH could provide a tailwind for INJ, supporting its upward trajectory and helping it reach the projected targets.
Unlocking Crypto Upside Potential: What’s Next for INJ?
The confluence of a bullish harmonic pattern, strong support from the 200-day moving average, and a favorable broader market environment driven by Ethereum’s performance paints an optimistic picture for Injective. The projected target of $18.10 represents a significant crypto upside potential of 27% from current levels, making INJ an exciting asset to watch.
However, it’s crucial to remember that technical analysis, while powerful, is not a guarantee. Harmonic patterns are probabilistic tools, and their validity hinges on sustained buying pressure and the price holding above key support levels. Minor pullbacks are always possible during an upward move, and traders should be prepared for volatility. The crypto market remains dynamic, influenced by both technical indicators and external macroeconomic factors such as regulatory developments or shifts in global investor risk appetite.
Exploring Injective’s Role as a Leading DeFi Token
Beyond the charts and patterns, it’s important to understand *what* Injective is and why it holds such promise as a DeFi token. Injective is a blockchain built for finance, offering a robust platform for decentralized applications (dApps) in the DeFi space. It provides a powerful layer-one blockchain that supports various financial primitives, including decentralized spot and derivatives exchanges, prediction markets, and lending protocols.
Its architecture is designed to address key challenges in decentralized finance, such as scalability, interoperability, and front-running. By enabling developers to build highly performant and secure DeFi applications, Injective positions itself as a critical infrastructure provider in the evolving decentralized financial landscape. This fundamental strength, combined with positive technical signals, makes INJ a compelling asset for long-term holders and short-term traders alike.
Key Takeaways and Actionable Insights
Injective’s recent surge and the identified harmonic pattern present a compelling narrative for potential continued growth. Here are some actionable insights and key takeaways for investors:
- Monitor Key Levels: The 200-day moving average at $12.77 is a critical support level. A sustained break below this could invalidate the bullish outlook.
- Observe Volume: Strong buying volume accompanying the price increase adds credibility to the move. A lack of volume on rallies could signal weakness.
- Broader Market Sentiment: Keep an eye on overall crypto market trends, particularly Ethereum’s performance, as it often influences altcoins.
- Risk Management: Always apply proper risk management strategies. Technical analysis provides probabilities, not certainties. Consider stop-loss orders to protect capital.
- Fundamental Analysis: While this article focuses on technicals, remember to also consider Injective’s ongoing development, partnerships, and adoption within the DeFi ecosystem.
The combination of strong technical signals and a supportive market environment makes Injective an exciting asset to watch. As the DeFi space continues to evolve, projects like INJ that offer robust, scalable solutions are likely to capture significant attention and capital.
Conclusion: Riding the Wave of Injective’s Potential
The recent performance of Injective (INJ), marked by a significant 7% surge and a 26% monthly gain, has positioned it as a standout performer in the current crypto landscape. The identification of a bullish harmonic ABCD pattern, pointing towards a potential 27% upside to $18.10, adds a layer of technical conviction to its trajectory. Coupled with strong support from the 200-day moving average and a favorable broader market sentiment buoyed by positive Ethereum news, INJ appears poised for further growth. While the world of cryptocurrency remains inherently volatile, the convergence of these positive indicators offers a compelling case for Injective’s continued ascent. As always, thorough research and prudent risk management are essential for navigating this exciting market.
Frequently Asked Questions (FAQs)
What is a harmonic pattern in crypto trading?
A harmonic pattern is a technical analysis tool that uses Fibonacci ratios and specific price formations (like ABCD, Gartley, Butterfly) to identify potential trend reversals or continuations. These patterns help traders predict future price movements and establish target levels based on historical price action.
Why is the 200-day moving average important for Injective (INJ)?
The 200-day moving average (200-DMA) is a widely watched long-term indicator. For Injective, its price bouncing off the 200-DMA at $12.77 signifies strong support. Historically, holding above this level indicates a healthy, long-term bullish trend, while breaking below it can signal a shift to a bearish outlook.
How does Ethereum’s performance affect Injective (INJ)?
Ethereum (ETH) is a major influencer in the altcoin market. Positive performance and news from Ethereum often create a ‘risk-on’ sentiment, encouraging investors to put capital into other altcoins, especially those in the DeFi ecosystem like Injective. ETH’s strength can provide a tailwind for INJ’s price appreciation.
What is the projected upside potential for Injective (INJ) based on this analysis?
Based on the identified harmonic ABCD pattern, Injective (INJ) shows a potential upside target of approximately $18.10. This represents a 27% increase from its recent price levels, assuming the pattern holds and buying momentum continues.
Is investing in Injective (INJ) guaranteed to reach the target?
No, technical analysis, including harmonic patterns, provides probabilities, not guarantees. The crypto market is highly volatile and influenced by numerous factors. Investors should conduct their own research, consider fundamental factors, and apply proper risk management strategies, as price targets are not assured.


