Urgent: How Low Can Bitcoin Price Go? Expert BTC Analysis

Bitcoin (BTC) has seen a recent dip, dropping about 10% from its recent all-time highs. This movement has sparked conversations across the market: just how low can Bitcoin price go before finding a solid floor? Traders and analysts are weighing in, looking at charts and data to identify potential support zones. This period is crucial for understanding the current market sentiment and setting expectations for the near future.
Expert BTC Price Analysis
Following a strong run, Bitcoin has entered a consolidation phase. While many anticipate a swift return to upward momentum, some market participants express caution. Popular trader Roman suggests that the current bull market may be nearing its conclusion. His perspective is based on the observation of diminishing returns across previous market cycles.
Roman noted on X, “This cycle so far 600%, Last cycle we saw 2,000% the cycle before we saw 10,000%.” He concluded, “If you haven’t noticed, returns are diminishing over time. It’s likely that we’ve topped or are extremely close!” His analysis points to key support levels on higher timeframes, including the $105,000 mark. He expects sideways price action if this level is tested.
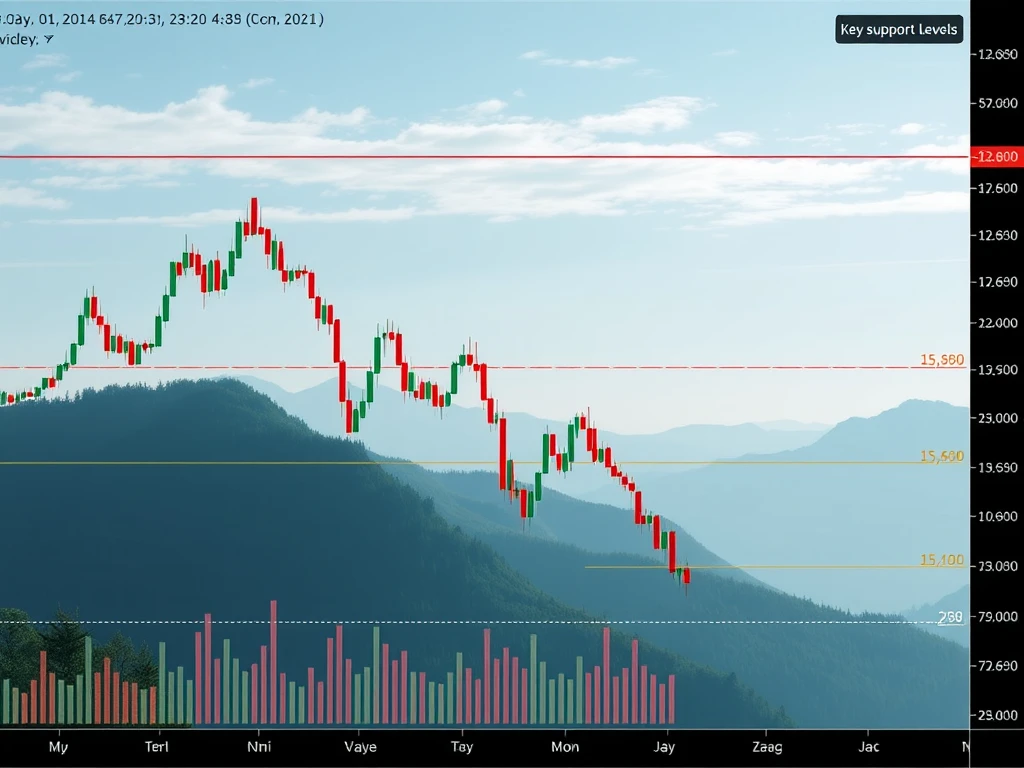
Identifying Key Bitcoin Support Levels
Beyond Roman’s view, other analysts are highlighting levels potentially below the six-figure mark. MarketWizard pointed to $102,000 as a likely target unless $107,000 is reclaimed.
Looking at exchange order books provides immediate insight into liquidity zones. The $103,000-$104,000 range shows immediate interest. However, data from CoinGlass on liquidation heatmaps reveals potential targets below this.
Trading account TheKingfisher explained the significance of these clusters: “Notice the significant long liquidation clusters below current price, especially around the 103K and 99K zones. This shows where leveraged long positions will get wiped out and acts as a potential support.” The $99,000 zone stands out as a notable area where cascading liquidations could occur, potentially acting as a strong, albeit volatile, support.
Understanding Bitcoin Market Analysis with On-Chain Data
Zooming out, on-chain analytics platform Glassnode identified three important support trend lines that are key for Bitcoin market analysis. These include two daily simple moving averages (SMAs) and the short-term holder cost basis. These levels are considered significant indicators for evaluating market momentum and trend strength.
- The 111-day SMA is currently around $92,100.
- The 200-day SMA sits around $94,700.
- The Short-Term Holder Cost Basis is approximately $95,900.
Glassnode highlighted that the short-term holder cost basis, which reflects the average acquisition price for recent investors, has historically served as a critical threshold, often marking the boundary between local bull and bear market regimes. The current price is trading above all three levels, indicating market strength. However, the convergence of these levels creates a robust support zone that is vital to hold for continued upside momentum.
Latest Bitcoin Price Prediction Insights
Combining these technical and on-chain perspectives offers a clearer picture of potential downside targets. While immediate support lies in the $103k-$105k range, a break below could see prices test the liquidation cluster around $99k. Further downside might bring the important Glassnode levels between $92k and $96k into play. These levels represent significant historical support and areas where buying interest could re-emerge.
How Low Bitcoin Go: What Data Suggests
Based on the current data and analyst views, potential downside targets for Bitcoin price action range from the immediate $103k-$104k zone, extending down to the $99k liquidation cluster, and finally the confluence of SMAs and the short-term holder cost basis between $92k and $96k. The market’s reaction at each of these levels will be crucial in determining the short-term trajectory. Traders and investors are closely watching these zones for signs of a potential local bottom before the market decides its next major move.
This article does not contain investment advice or recommendations. Every investment and trading move involves risk, and readers should conduct their own research when making a decision.


