Ether.fi (ETHFIUSDT) Market Analysis: Key Insights for July 30, 2025
Are you tracking Ether.fi (ETHFIUSDT) in the volatile crypto market? On July 30, 2025, ETHFIUSDT showed intriguing patterns that every trader should know. Let’s dive into the key insights and what they mean for your trading strategy.
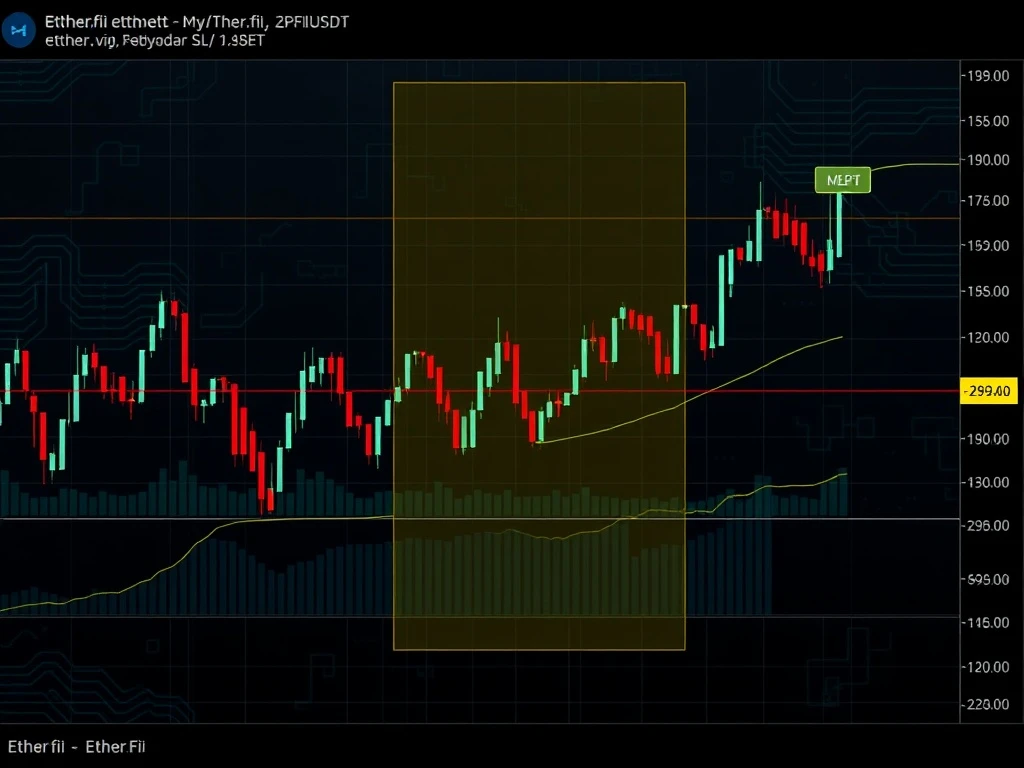
Ether.fi (ETHFIUSDT) Price Action Overview
Ether.fi (ETHFIUSDT) traded between $1.13 and $1.226, closing at $1.138. The session highlighted critical support at $1.138 and resistance at $1.191. Here’s what stood out:
- Bearish Divergence: Price and volume showed weakening bullish momentum.
- Volatility: Expanded midday before contracting into consolidation.
- RSI & MACD: Briefly overbought but lacked follow-through.
Key Technical Indicators for ETHFIUSDT
Technical analysis reveals crucial signals for Ether.fi traders:
| Indicator | Observation |
|---|---|
| Moving Averages | Bearish crossover on 15-minute chart; daily chart shows longer-term bullish bias. |
| MACD & RSI | Bearish divergence and neutral RSI closing suggest caution. |
| Bollinger Bands | Volatility contraction hints at consolidation. |
What’s Next for Ether.fi (ETHFIUSDT)?
Traders should watch these levels:
- Support: $1.138 (critical for bullish recovery).
- Resistance: $1.191–$1.196 (breakout could signal bullish intent).
Weak volume and bearish divergences suggest a potential consolidation phase. Stay alert for breaks above resistance or below support.
FAQs
1. What caused the midday rally in ETHFIUSDT?
The rally was driven by strong buying pressure, with volume peaking at 717,571.7. However, it lacked sustained momentum.
2. Is Ether.fi (ETHFIUSDT) in a bullish or bearish trend?
The daily chart shows a longer-term bullish bias, but short-term indicators suggest caution due to bearish divergences.
3. What are the key levels to watch?
Monitor $1.138 (support) and $1.191–$1.196 (resistance) for directional clues.
4. Should traders expect volatility soon?
The contraction in Bollinger Bands suggests consolidation, but a breakout could reignite volatility.


