Ethereum Price: Whale’s Strategic $16.3M Long Signals Optimistic ETH Price Bounce

The cryptocurrency market often sees bold moves from major players. Recently, a significant development caught the attention of many: an Ethereum whale has opened a massive $16.35 million long position on Ether (ETH). This aggressive leveraged bet signals a strong belief in an imminent ETH price bounce, suggesting that the recent dip might be over. Such large-scale trades often precede notable market movements, drawing keen interest from traders and analysts alike.
Understanding the Massive Ethereum Whale Bet
Large traders frequently raise their stakes, placing substantial capital on specific price movements. In this instance, a prominent Ethereum whale is betting on ETH price avoiding a trip below $4,000. Instead, they anticipate a rebound toward $4,300 in the near future. This particular position, entered at $4,229.83 per ETH, utilizes 25x leverage. This level of leverage amplifies both potential gains and losses. Currently, ETH trades just above $4,240, placing the position already in a slight profit. To illustrate the scale, a mere 1% rise from the entry point would generate over $163,000 in profit for this colossal trade.
Liquidation Heatmaps: A Key Indicator for ETH Price Bounce
Fresh liquidation heatmaps provide crucial insights into the timing of this whale’s entry. Data from Kingfisher reveals a dense cluster of short liquidations. These lie primarily above $4,300–$4,360. A particularly large pocket exists near $4,336. Markets often gravitate towards such liquidity “magnets.” Market makers actively hunt these stops, triggering cascading liquidations. This strategic aspect means ETH does not require a full-blown breakout to validate the whale’s trade. A simple push into the $4,336 liquidity pool could generate multimillion-dollar paper gains. For example, the whale’s position could see nearly $450,000 in unrealized profit if ETH reaches that specific level.
However, risks remain significant with leveraged positions. A 4.34% drop to around $4,046 would completely liquidate this massive trade. Such a move would erase the entire margin behind the position, highlighting the high stakes involved in such large-scale leveraged trading.
Deep Dive into ETH Technical Analysis
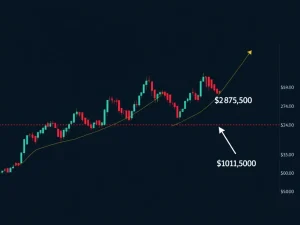
The question of whether Ether has found a local bottom is paramount for many investors. Encouragingly, Ethereum maintains a strong hold above its 20-day exponential moving average (20-day EMA). This green wave has consistently guided the uptrend since July, with only a brief breakdown occurring last month. The 20-day EMA now aligns with the lower boundary of a developing falling wedge pattern on the daily chart. This pattern is a classic bullish reversal setup. This confluence of strong support levels significantly strengthens the case for the whale’s $16.35 million long bet.
Should the falling wedge and 20-day EMA fractal play out, ETH could target an upside around $4,750. This represents nearly a 13% increase from current levels. Conversely, a close below $4,140 risks invalidating this bullish setup, signaling potential further downside. Therefore, monitoring these critical support and resistance levels is essential for understanding future Ethereum price movements.
Long-Term Outlook: Ethereum’s Crucial Retest and Future Targets
Zooming out to the weekly chart reveals an even broader bullish narrative for Ethereum. Analysts describe the current price action as one of the most “obvious weekly retests” in years. This suggests a pivotal moment for the asset. DIY Investing, a prominent analyst, notes that Ethereum has successfully flipped its “biggest resistance” area. This zone, previously around $3,900-$4,000, now acts as robust support. This transformation from resistance to support is a powerful bullish signal in technical analysis. DIY Investing further asserts, “$ETH to $8k once this retest holds.” This ambitious target highlights the significant upside potential many analysts see for Ethereum.
The confluence of a major whale’s leveraged bet, strategic liquidation levels, and strong technical indicators paints an optimistic picture for Ethereum’s near-term and long-term prospects. This collective evidence supports the idea of an impending ETH price bounce. However, market volatility remains a constant factor. Traders must remain vigilant, managing risk effectively in such high-stakes environments. The coming days will be crucial in determining if this whale’s bold wager pays off and if Ethereum continues its upward trajectory toward new highs.
Key Takeaways for Investors and Traders
- An Ethereum whale placed a $16.35 million leveraged long position, anticipating an ETH price bounce.
- Short liquidation clusters between $4,300 and $4,360 act as potential price magnets.
- Key technical supports include the 20-day EMA and a falling wedge pattern.
- A break above current levels could see ETH target $4,750, with a long-term potential of $8,000.
- The trade faces liquidation at approximately $4,046, highlighting inherent risks.
This article does not contain investment advice or recommendations. Every investment and trading move involves risk, and readers should conduct their own research when making a decision. Past performance is not indicative of future results.


