Ethereum News: Explosive $4,000 Breakout Looms as ETH Mirrors Bitcoin’s 2020 Surge
Ethereum is making headlines as its price action eerily mirrors Bitcoin’s 2020 breakout pattern. With a potential $4,000 breakout on the horizon, traders and analysts are buzzing about what this could mean for ETH’s future. Will history repeat itself, or are there new challenges ahead?
Ethereum News: The Bitcoin 2020 Pattern Repeats
Ethereum’s current price action is drawing comparisons to Bitcoin’s 2020 surge. A descending triangle formation on ETH’s chart closely resembles the pattern Bitcoin displayed before its explosive rally. Key similarities include:
- Consolidation above long-term support levels
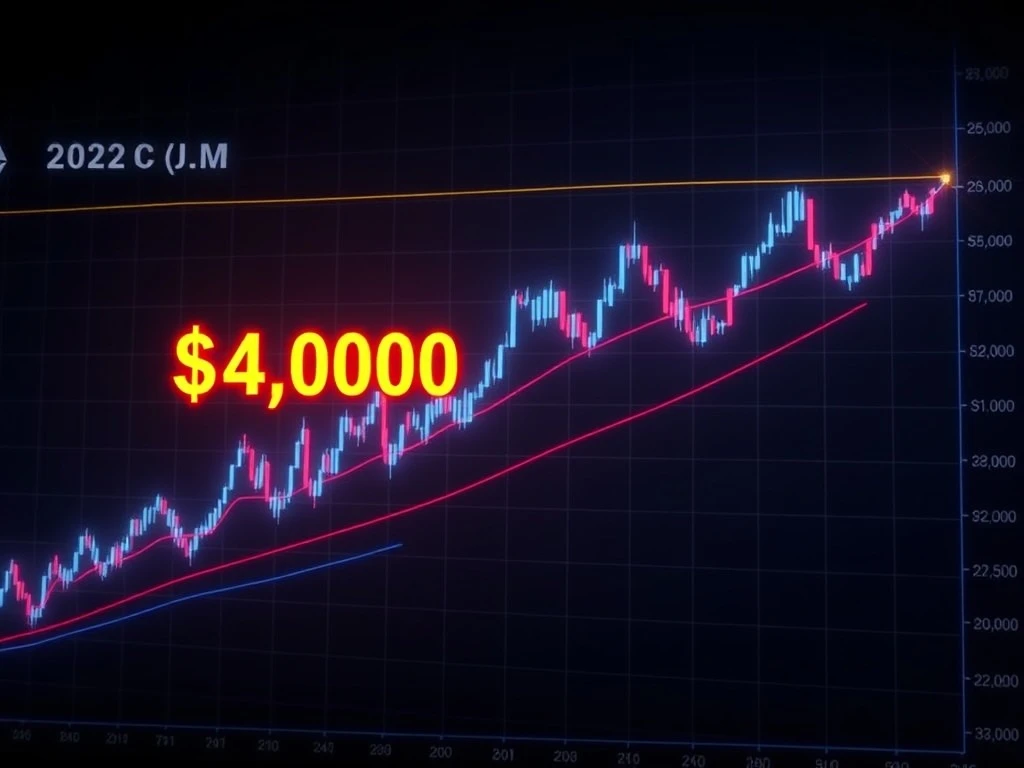
- Repeated testing of a major resistance zone ($4,000 for ETH)
- Increasing trading volume as the pattern develops
$4,000 Breakout: The Gateway to Higher Targets
The $4,000 level has become a critical battleground for Ethereum. Technical indicators suggest:
| Indicator | Signal |
|---|---|
| RSI | Neutral (58), room for upward movement |
| Moving Averages | Price above 50-day and 200-day MA |
| Volume | Increasing on upward moves |
Ethereum Price Prediction: How High Can It Go?
If Ethereum follows Bitcoin’s 2020 trajectory, analysts project:
- Initial target: $4,500 after $4,000 breakout
- Mid-term potential: $7,000-$8,000 range
- Long-term possibility: $10,000+ if bullish momentum sustains
Bullish Trend vs. Potential Risks
While the technical setup appears strong, traders should consider:
- Regulatory developments in major markets
- Competition from other smart contract platforms
- Macroeconomic factors affecting crypto markets
Frequently Asked Questions
Why is Ethereum’s price action compared to Bitcoin’s 2020 pattern?
The technical formations and market conditions are strikingly similar, with both assets showing descending triangle patterns before major breakouts.
What confirms a genuine $4,000 breakout for Ethereum?
Traders look for:
- Daily close above $4,000 with strong volume
- Follow-through buying in subsequent sessions
- Confirmation from other technical indicators
How long might Ethereum’s potential rally last?
If following Bitcoin’s 2020 pattern, the rally could extend for several months, potentially peaking in late 2025 or early 2026.
What are the key support levels if Ethereum reverses?
Major support zones to watch include $3,600, $3,200, and the psychological $3,000 level.