Ethereum Classic (ETCUSDT) Market Analysis: Bearish Signals Emerge Amid Volatility (2025-07-30)

Ethereum Classic (ETCUSDT) traders faced a volatile 24-hour session on July 30, 2025, with bearish signals emerging despite short-term bullish momentum. Did the market reveal hidden opportunities for savvy traders? Let’s break down the key movements and indicators.
Ethereum Classic Price Action: Key Levels to Watch
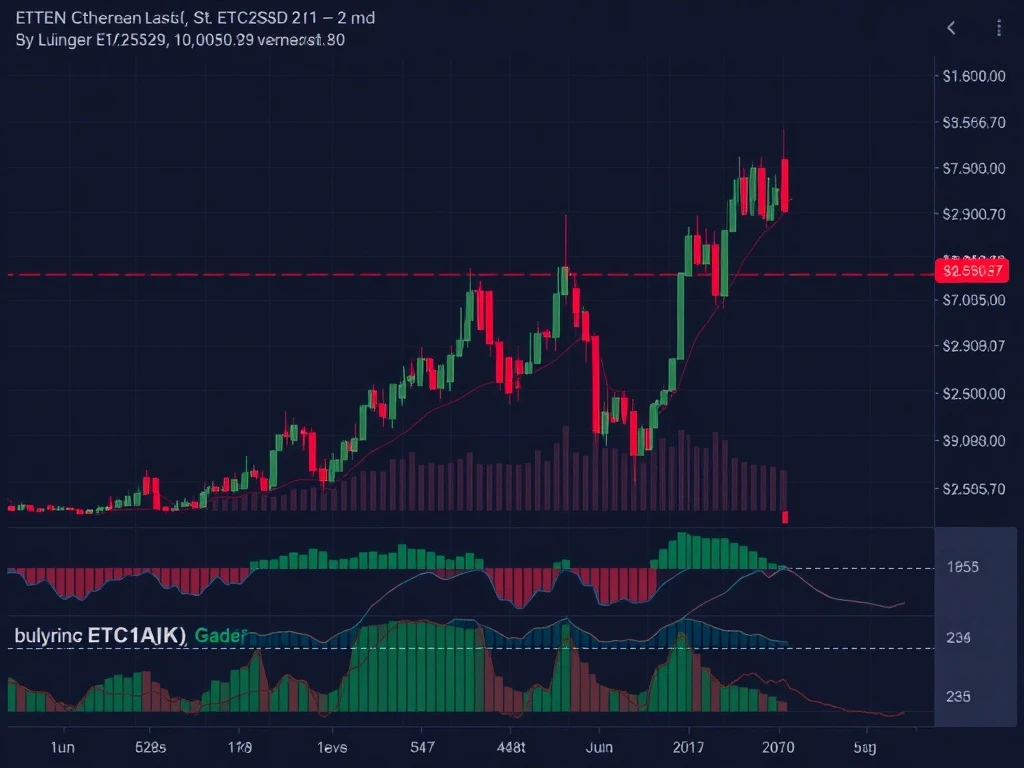
ETCUSDT traded between $21.46 and $22.05, closing at $21.55 after showing early strength. The session revealed:
- Resistance zone: $21.95–$22.05 proved challenging for bulls
- Support area: $21.65–$21.46 held during pullbacks
- Volume spikes: 10,804.6 ETC traded at 20:15 ET during sharp decline
Technical Indicators Flash Warning Signs
Multiple bearish signals appeared in the ETCUSDT market:
| Indicator | Signal | Implications |
|---|---|---|
| MACD | Bearish crossover | Potential trend reversal |
| RSI | Overbought then declining | Profit-taking likely |
| Bollinger Bands | Price touched upper band | Possible retracement |
Crypto Trading Strategies for Current Market Conditions
Traders should consider these approaches for ETCUSDT:
- Watch for confirmation at $21.73 Fibonacci level
- Monitor volume during breakout attempts
- Consider short positions if $21.46 support breaks
- Use tight stop-losses given volatility
Conclusion: Proceed With Caution
While Ethereum Classic shows some bullish elements on shorter timeframes, the weight of evidence suggests caution. The bearish engulfing pattern, MACD crossover, and RSI behavior all point to potential downside. Traders should wait for clearer signals before committing to large positions.
Frequently Asked Questions
What caused the volatility in ETCUSDT on July 30?
The 19:30–22:00 ET window saw expanded volatility likely due to a combination of technical factors (overbought RSI) and possible large trader activity.
Is Ethereum Classic in a long-term bearish trend?
Daily moving averages suggest a broader bearish trend, with price below the 200-day MA. However, short-term movements can still present trading opportunities.
What’s the most important level to watch now?
The $21.73 Fibonacci level and $21.95 resistance zone will be critical for determining next direction.
How reliable are these technical signals?
While technical analysis provides useful frameworks, crypto markets can change rapidly. Always use multiple indicators and risk management.


