Ethena (ENA) Plummets 6% But a Fractal Pattern Signals a Stunning 90% Upside
Ethena (ENA) has recently seen a 6% drop, but a fascinating fractal pattern suggests a massive 90% upside could be on the horizon. Could this be the next big breakout in the altcoin market?
Ethena (ENA) Faces a Short-Term Dip
As of July 30, 2025, Ethena (ENA) has declined by 6%, trimming its 30-day gains to 109%. This pullback aligns with Ethereum’s retreat from a key resistance level near $3,940. However, technical analysis reveals a potential bullish reversal.
Fractal Pattern Mirrors 2024 Breakout
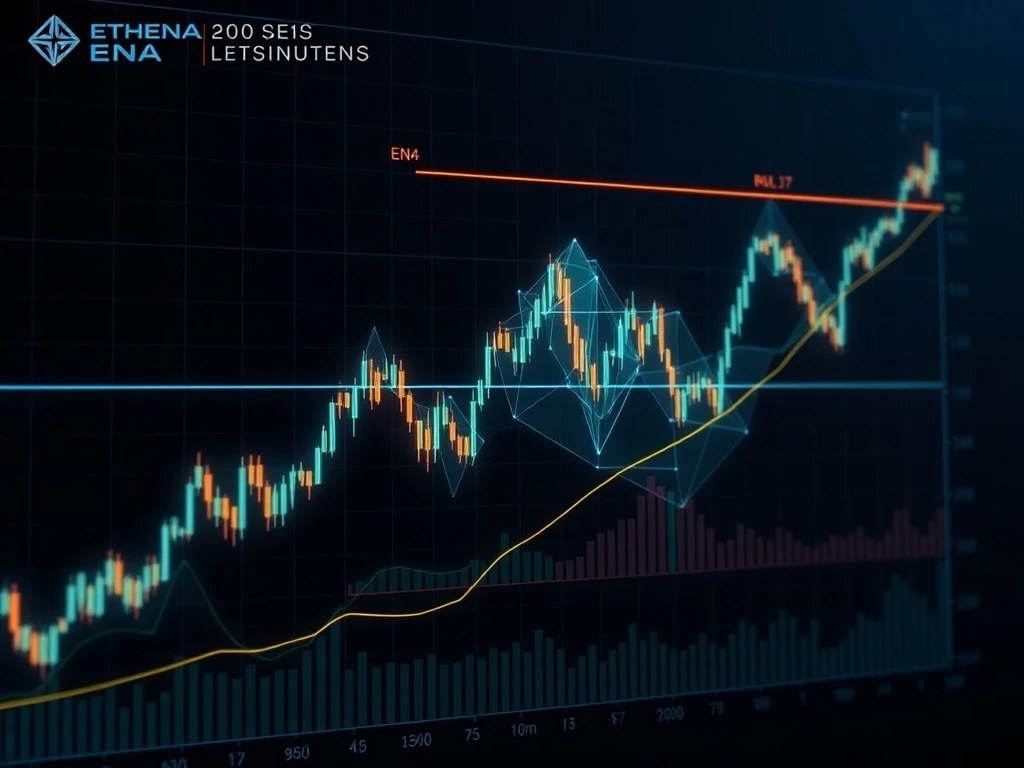
ENA’s daily chart shows a rounded V-shaped bottom and a breakout from a downward wedge, retesting the 200-day moving average. This pattern closely resembles its 2024 breakout, which led to an 89% surge. Key observations:
- Double-bottom reversal initiated by a falling wedge breakout.
- Bullish reclaim of the 200-day moving average.
- Consolidation below the same horizontal resistance level as in 2024.
Potential 90% Upside for Ethena (ENA)
If ENA breaks above the $0.70 resistance zone, it could validate the fractal pattern and target $1.33—a 90% upside. Analysts caution that a short-term correction may occur before confirmation, but the setup remains promising.
Market Volatility and Investor Caution
While the fractal pattern is optimistic, the cryptocurrency market remains volatile. Investors should conduct independent research and avoid relying solely on technical analysis.
Conclusion: Is Ethena (ENA) Poised for a Major Breakout?
The fractal pattern suggests ENA could replicate its 2024 surge, but market conditions will play a crucial role. Keep an eye on key resistance levels and market trends.
Frequently Asked Questions (FAQs)
Q: What is a fractal pattern in cryptocurrency trading?
A: A fractal pattern is a repeating price structure that traders use to predict future movements based on past behavior.
Q: How reliable is the fractal pattern for Ethena (ENA)?
A: While historical patterns can provide insights, cryptocurrency markets are highly volatile, and past performance doesn’t guarantee future results.
Q: What key levels should I watch for ENA?
A: Monitor the $0.70 resistance zone and the 200-day moving average for potential breakout signals.
Q: Should I invest in Ethena (ENA) based on this analysis?
A: Always conduct your own research and consider market risks before making investment decisions.


