Crucial Bitcoin Price Prediction & Altcoin Market Analysis (May 5)
Welcome back to our regular market analysis! Today, we’re diving into the current state of the crypto market, focusing on crucial price predictions for top digital assets like Bitcoin, Ethereum, and various altcoins, alongside traditional market indicators like the S&P 500 and the US Dollar Index. Let’s break down what’s happening and what key levels to watch.
Navigating the Current Crypto Market Analysis
The cryptocurrency market is currently a battlefield, with bulls and bears wrestling for control, particularly around significant price levels. Bitcoin, the market leader, has seen intense action. Despite slipping below the $95,000 mark recently, consistent buying demand at lower supports is keeping the pressure on overhead resistance.
Key insights from recent market activity include:
- Bitcoin faces a tough challenge near the $95,000 level as sellers emerge.
- Strong inflows into spot Bitcoin ETFs last week suggest renewed positive sentiment from institutional investors.
- Many altcoins have successfully held their critical support levels, hinting at potential upward movements in the near term.
Data indicates significant profit-taking has occurred as Bitcoin pushed into the $93,000 to $96,000 range. One report highlighted that for every dollar realized in loss, over $9 in profits were realized. However, the substantial $1.8 billion inflow into US-based Bitcoin ETFs last week, acquiring far more BTC than was mined, provides a strong bullish counterpoint.
Understanding the broader financial landscape is also key to a complete market analysis. Let’s briefly look at the S&P 500 and the US Dollar Index.
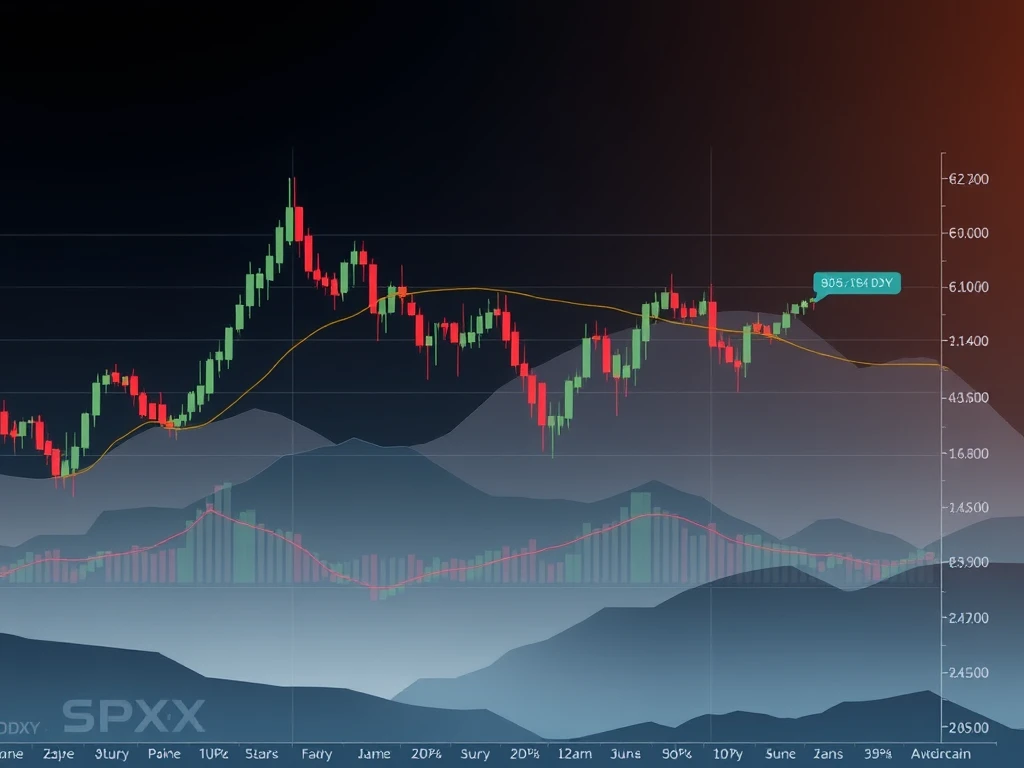
S&P 500 Index Price Prediction
The S&P 500 (SPX) has shown recovery, climbing above its 50-day simple moving average. With the 20-day exponential moving average turning up and the RSI in positive territory, buyers seem to have the advantage. The next potential target is 5,800, where selling pressure might increase. Support is expected around the 20-day EMA. A break below this could see the index drop towards 5,400 or even 5,300.
US Dollar Index Price Prediction
The US Dollar Index (DXY) bounced from the 99 support level, reaching its 20-day EMA. While facing resistance here, the lack of significant pullback suggests buyers are persistent. A break above the 20-day EMA could lead to a rise towards the 61.8% Fibonacci retracement level at 101.39 and potentially the 50-day SMA at 102.72. Conversely, a drop below 99 would invalidate this view, potentially sending the index towards 97.92.
What’s the Latest Bitcoin Price Prediction?
Bitcoin’s recent close below $95,000 on May 4 indicates sellers are active at higher prices. Bears are currently attempting to push the price towards the 20-day EMA, located around $92,204. This level is crucial for bulls to defend to maintain upward momentum.
Key levels for Bitcoin (BTC/USDT):
- Crucial Support: 20-day EMA ($92,204)
- Next Support: 50-day SMA ($86,890)
- Key Resistance: $95,000
- Psychological Target: $100,000
If BTC successfully bounces off the 20-day EMA, bulls will likely target the $100,000 psychological barrier again. However, a clear break and close below the 20-day EMA would signal increased selling pressure, potentially leading to a test of the 50-day SMA. A deeper pullback could suggest a period of range-bound trading.
Ethereum Price Prediction Insights
Ether (ETH) has demonstrated resilience, holding above its moving averages. The gradually rising 20-day EMA and positive RSI suggest that the path of least resistance for the Ethereum price prediction is currently upwards.
Key levels for Ether (ETH/USDT):
- Support: Moving averages (around $1,771 for 20-day EMA)
- Minor Resistance: $1,957
- Major Resistance: $2,111 (breakdown level)
- Strong Supports: $1,537 and $1,368
While minor resistance exists at $1,957, ETH appears poised to challenge the $2,111 level, where sellers are expected to defend aggressively. A move below the moving averages, however, would shift the focus to lower supports at $1,537 and $1,368.
What’s Next for Altcoin Price Predictions?
Beyond Bitcoin and Ethereum, several other major altcoins are at interesting junctures. Let’s look at the altcoin price prediction outlook for some of the top contenders:
XRP Price Prediction
XRP remains range-bound between a resistance line and the $2 support. Flattened moving averages and an RSI near the midpoint indicate a current balance. A break above the resistance line would favor bulls, potentially leading to a surge towards $3. Conversely, a close below $2 would empower sellers, with the next key support at $1.61.
BNB Price Prediction
BNB dipped below its moving averages but is finding buying interest at lower levels. If buyers can push BNB back above the moving averages, it signals strength, targeting $620 and potentially $644. A turn down from the moving averages suggests bears are active, with support in the $576-$566 zone before a potential drop to $520.
Solana Price Prediction
Solana (SOL) is finding support at the 20-day EMA ($143), showing bulls are buying dips. A push above the $153 resistance could see SOL rise to $180, bringing the larger $110-$260 range into play. A break below the 20-day EMA would shift focus to the 50-day SMA ($133), potentially leading to consolidation between $110 and $153.
Dogecoin Price Prediction
Dogecoin (DOGE) is holding above its moving averages but lacks strong upward momentum. Flat moving averages and a neutral RSI suggest DOGE might stay within the $0.21 to $0.14 range. A move up from the moving averages targets $0.21, with a potential breakout to $0.28. A break below the moving averages could see DOGE test the solid $0.14 support.
Cardano Price Prediction
Cardano (ADA) is battling near its moving averages, with neither bulls nor bears holding a clear advantage based on flat moving averages and a neutral RSI. A close above $0.75 would be a sign of strength, potentially leading to a rally to $0.83. A close below the moving averages would favor bears, targeting solid support at $0.58 before a potential drop to $0.50.
Sui Price Prediction
Sui (SUI) is attempting to bounce off its 20-day EMA ($3.09), indicating demand at lower levels. The upsloping 20-day EMA and positive RSI suggest buyers have an edge. A push towards the $3.90 resistance is expected, with a break above potentially leading to $4.25 and then $5. A turn down from resistance or a break below the 20-day EMA would signal weakness, potentially pulling SUI to $2.86 and the 50-day SMA ($2.57).
In Conclusion: Watching Key Levels
The cryptocurrency market, including key players like Bitcoin and Ethereum, alongside various altcoins, is at a critical juncture. While Bitcoin faces resistance, strong institutional inflows provide underlying support. Altcoins are holding key levels, offering potential for short-term moves.
Keeping a close eye on the identified support and resistance levels for each asset, as well as broader market indicators like the S&P 500 and DXY, is essential for navigating the coming days. Remember, this market analysis is based on technical indicators and market sentiment, and every investment carries risk. Always conduct your own thorough research.