Urgent Alert: Why is Cardano Price Plunging Today? Critical Market Analysis
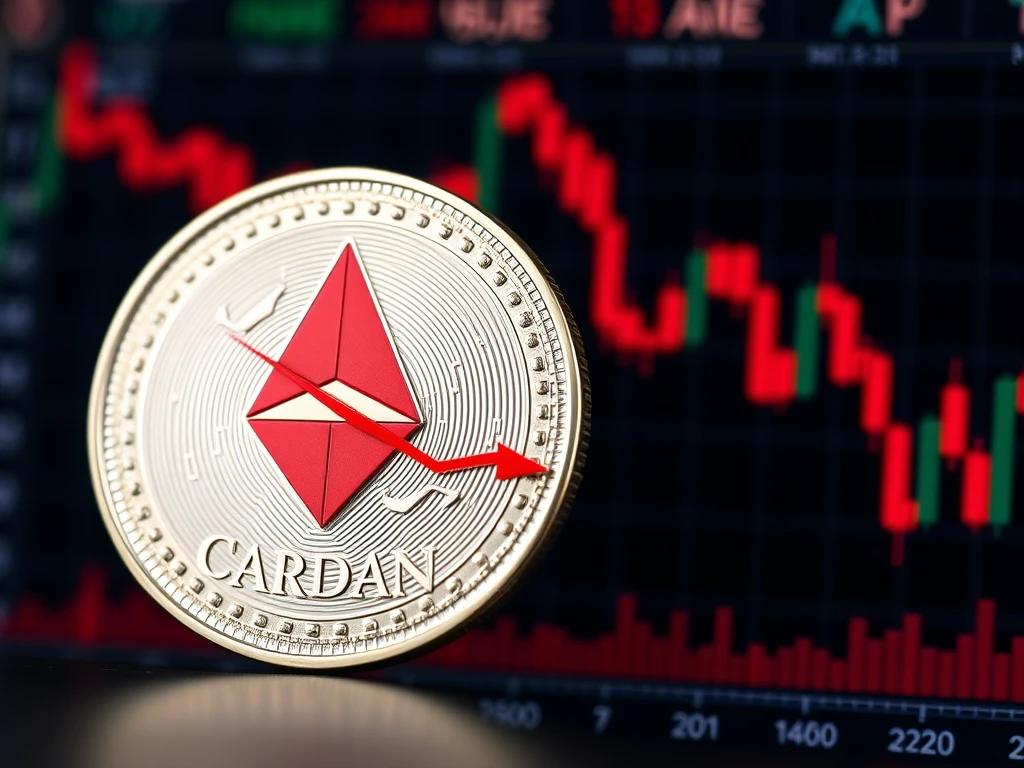
Navigating the volatile cryptocurrency market can be challenging, especially when you see your portfolio’s assets like Cardano (ADA) taking a dip. Today, Cardano investors are witnessing a significant price correction, prompting many to ask: Why is Cardano price down today? Let’s delve into the key factors driving this downturn and what it means for ADA’s future.
Why is Cardano Price Down Today? Unpacking the Bearish Trends
Cardano’s (ADA) price has experienced a notable decrease, currently trading around $0.6529, marking a 4.5% drop in the last 24 hours and a substantial 10% decline over the past week. This bearish trend is further emphasized by a 45% fall from its March 2 high. To understand this price action, we need to examine the underlying factors at play. Several elements are contributing to this downward pressure on ADA, including:
- Diminishing Network Activity: A significant decrease in user engagement and transactions on the Cardano network.
- Negative Funding Rates: Bearish sentiment prevailing in the derivatives market, indicating more traders are betting against ADA.
- Stiff Upward Resistance: Technical indicators suggesting strong resistance levels preventing price recovery.
Cardano Network Activity: A Sharp Decline
One of the most concerning indicators for Cardano’s current price struggle is the sharp decline in network activity. Let’s examine the data:
| Metric | March 2 | March 31 | Percentage Change |
|---|---|---|---|
| Daily Active Addresses | 70,700 | Less than 20,000 | -70% |
| Daily Transactions | High | Significantly Lower | -71% |
As you can see, both daily active addresses and daily transactions have plummeted dramatically within a month. This reduction in on-chain activity suggests less user engagement and potentially lower confidence in the network’s immediate growth prospects, directly impacting the Cardano price down trend.
Total Value Locked (TVL) in Cardano: Is Enthusiasm Waning?
Another critical metric reflecting the health and vibrancy of a blockchain network is Total Value Locked (TVL). For Cardano, the TVL has also witnessed a significant decrease:
| Date | TVL (USD) |
|---|---|
| March 3 | $529.8 million |
| March 31 | $317.9 million |
The drop from nearly $530 million to under $320 million in TVL is substantial, indicating a 13% decrease in just the last five days. This decline in TVL further reinforces the narrative of reduced activity and potentially decreased investor confidence, contributing to the pressure on ADA price prediction and current market performance.
Derivatives Market Sentiment: Negative Funding Rates and Open Interest
Analyzing the derivatives market provides further insights into the bearish sentiment surrounding Cardano. Two key indicators here are funding rates and open interest.
- Negative Funding Rates: For the past four weeks, ADA funding rates have remained consistently negative. This means traders holding short positions are paying those with long positions to keep their trades open. This persistent negative funding rate is a strong signal of bearish dominance in the market, influencing the Cardano price down momentum.
- Declining Open Interest (OI): Cumulative open interest in ADA perpetual futures has been below $1.0 billion since March 4, significantly lower than the $1.50 billion peak in January. Historically, declining open interest suggests a lack of fresh capital and enthusiasm to drive prices upwards. This makes ADA vulnerable to further price declines, as even minor selling pressure can trigger liquidations and exacerbate the downward spiral.
Technical Analysis: Moving Averages and Resistance Levels
From a technical analysis perspective, Cardano’s price action has been constrained by key moving averages. Between March 9 and March 27, ADA struggled between the 50-day and 200-day Simple Moving Averages (SMAs).
- 50-day SMA Resistance: The 50-day SMA, currently around $0.7531, has acted as a significant resistance level. Every attempt to breach this level was met with increased selling pressure, preventing any potential price recovery.
- 200-day SMA Breakdown: On March 28, ADA’s price broke below the 200-day SMA at $0.7262, turning this crucial level into resistance. This breakdown is a bearish signal, indicating further potential downside.
The immediate support level to watch is the psychological level of $0.60. Below this, significant support could be found in the range of $0.5794 (February 28 low) to $0.5197 (November 2024 low). These levels are crucial for understanding potential bottom ranges in the current crypto market analysis for Cardano.
Navigating the Downturn: What’s Next for Cardano?
The current altcoin market conditions, coupled with Cardano-specific factors like reduced network activity and negative derivatives sentiment, are painting a bearish picture for ADA in the short term. For Cardano to reverse this trend and regain upward momentum, we need to see a resurgence in network activity, a shift in derivatives market sentiment, and a break above key resistance levels like the 50-day and 200-day SMAs.
Key Takeaways for Cardano Investors:
- Monitor Network Activity: Keep a close eye on daily active addresses and transaction volumes for signs of recovery.
- Watch Derivatives Market: Track funding rates and open interest for shifts in market sentiment.
- Observe Technical Levels: Pay attention to the $0.60 support and resistance levels around the 50-day and 200-day SMAs.
While the current situation presents challenges, the cryptocurrency market is known for its dynamic nature. A resurgence in broader market sentiment or positive developments within the Cardano ecosystem could potentially alter this bearish trajectory. However, for now, caution and informed decision-making are paramount. Remember, this analysis is for informational purposes and not financial advice. Always conduct thorough research before making any investment decisions in the cryptocurrency market.