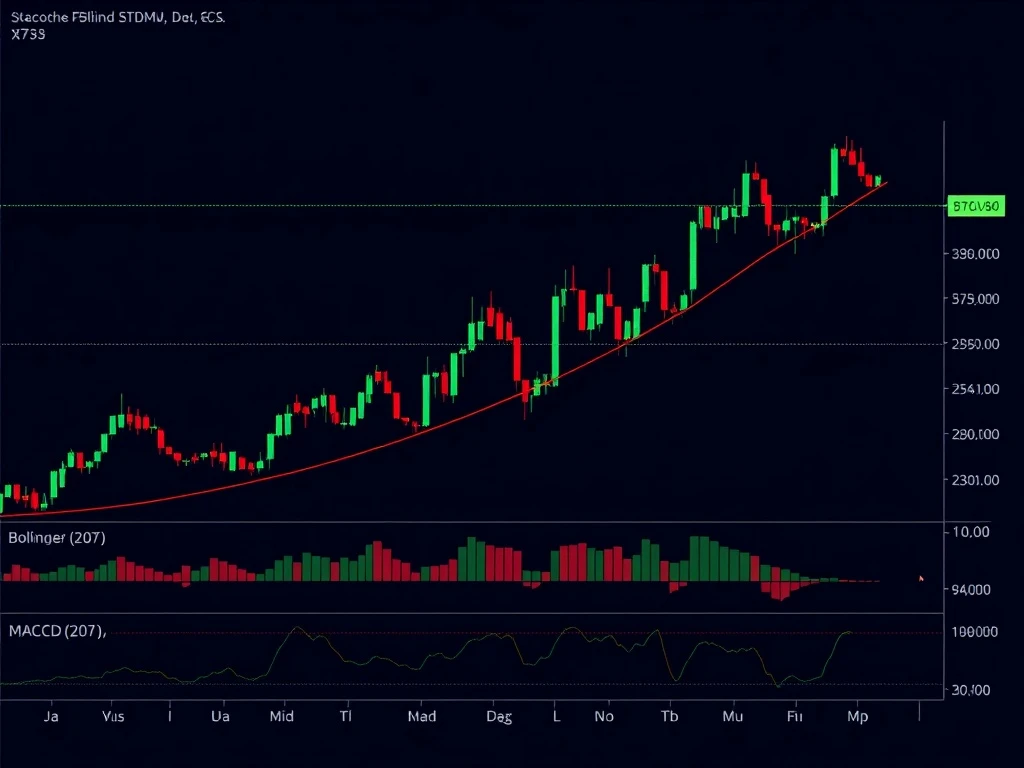
BTCUSDT Market Analysis: Bullish Trends and Key Signals for July 30, 2025

Are you tracking the latest BTCUSDT price action? On July 30, 2025, BTCUSDT showed strong bullish signals, with a breakout attempt between $117,900 and $118,250. Let’s dive into the key metrics and what they mean for traders.
BTCUSDT Market Overview: Bullish Consolidation
BTCUSDT opened at $117,470.00 and reached a high of $118,250.00, with a low of $116,950.75. The closing price was $117,929.58, with a total volume of 15,065.77 BTC ($1.77B). Key highlights:
- Price consolidated between $116,950.75 and $118,250.00.
- Bullish engulfing candle at $117,900.
- Three-white-soldiers formation in the final hours.
RSI and MACD: Momentum Builds
The RSI rose from 55 to 62, nearing overbought territory but not extreme. MACD showed a bullish crossover, with a growing histogram. This suggests:
- Increasing momentum.
- Potential for further upside.
- Possible consolidation before another move.
Bollinger Bands and Volume Confirmation
Price stayed within moderate volatility, with the upper band at $118,250 and the lower at $116,950. Volume surged in the final 4 hours, confirming the breakout attempt. No bearish divergence was observed.
Forward-Looking View: What’s Next for BTCUSDT?
The bullish consolidation phase suggests a potential breakout above $118,250. However, traders should watch for:
- RSI nearing overbought levels.
- A pullback to test the 61.8% Fibonacci level (~$117,900).
- A break below $117,900 could introduce short-term uncertainty.
Frequently Asked Questions (FAQs)
What caused the bullish trend in BTCUSDT?
The bullish trend was driven by strong volume, a bullish engulfing candle, and a three-white-soldiers formation, indicating buyer interest.
Is BTCUSDT overbought?
The RSI is nearing overbought territory (~65), but it’s not extreme, suggesting potential consolidation before further upside.
What are the key resistance levels?
Key resistance is at $118,100–118,250. A breakout above this could target $118,500.
What should traders watch for?
Traders should monitor RSI levels, volume trends, and Fibonacci retracement levels for confirmation of continued bullish momentum.


