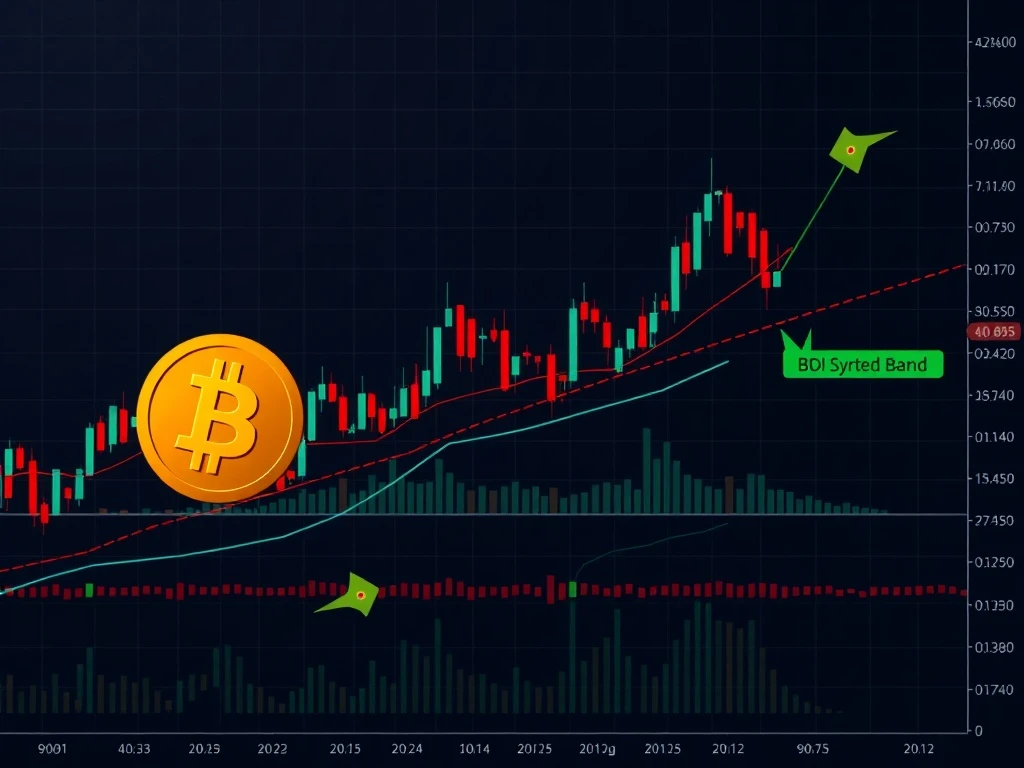
BTCUSDT Market Analysis: Bitcoin Rebounds from Key Support Levels in Volatile Session

Bitcoin (BTC) showcased a rollercoaster session on July 31, 2025, as BTCUSDT rebounded from key support levels amid heightened volatility. Traders witnessed a sharp sell-off followed by a bullish reversal, offering critical insights for short-term strategies. Here’s a breakdown of the 24-hour action.
BTCUSDT Price Action: Key Levels and Reversal Patterns
Bitcoin opened at $118,140, dipped to $116,509.47, and closed at $118,640.55, forming a bullish hammer near the 24-hour low. Key takeaways:
- Support Held Strong: The $116,500 and $117,000 levels prevented further downside, signaling buyer interest.
- Resistance Test: Price faces hurdles at $118,400–$118,600, with a potential breakout toward $118,700.
- Volume Surge: A 15-minute candle recorded 959.28 BTC traded during the sell-off, followed by a rebound with rising volume.
Bitcoin Price Momentum: Indicators Flash Mixed Signals
Technical tools revealed intriguing dynamics:
| Indicator | Observation |
|---|---|
| RSI | Dipped to 28 (oversold) but rebounded, reflecting cautious sentiment. |
| MACD | Bullish crossover near $118,200, suggesting short-term upside. |
| Bollinger Bands | Expanded to $1,000 width during volatility, hinting at potential breakout. |
Trading Strategies: How to Navigate BTCUSDT Volatility
With Bitcoin’s price action uncertain, consider these approaches:
- Range Trading: Buy near $117,000 (support) and sell at $118,600 (resistance).
- Breakout Play: A close above $118,700 could signal further upside.
- Risk Management: Tight stops below $116,500 to avoid downside traps.
Conclusion: Will Bitcoin Sustain Its Rebound?
Bitcoin’s rebound from oversold conditions suggests resilience, but traders must watch volume and key levels. A breakout above $118,700 could reignite bullish momentum, while a drop below $116,500 may invite deeper corrections. Stay agile in this volatile market.
Frequently Asked Questions (FAQs)
1. What caused Bitcoin’s sharp sell-off on July 30, 2025?
The drop to $116,509.47 was likely driven by profit-taking and leveraged liquidations, amplified by thin liquidity.
2. Is the bullish hammer candle a reliable reversal signal?
Yes, especially when accompanied by high volume and holding key support levels.
3. How does the 50-day MA impact Bitcoin’s trend?
Staying above the 50-day MA (~$117,500) suggests the broader uptrend remains intact.
4. What’s the significance of Bollinger Band expansion?
Widening bands indicate rising volatility, often preceding major price moves.
5. Should traders expect a breakout soon?
Monitor the $118,600–$118,800 zone. A high-volume breakout could confirm a new leg up.


