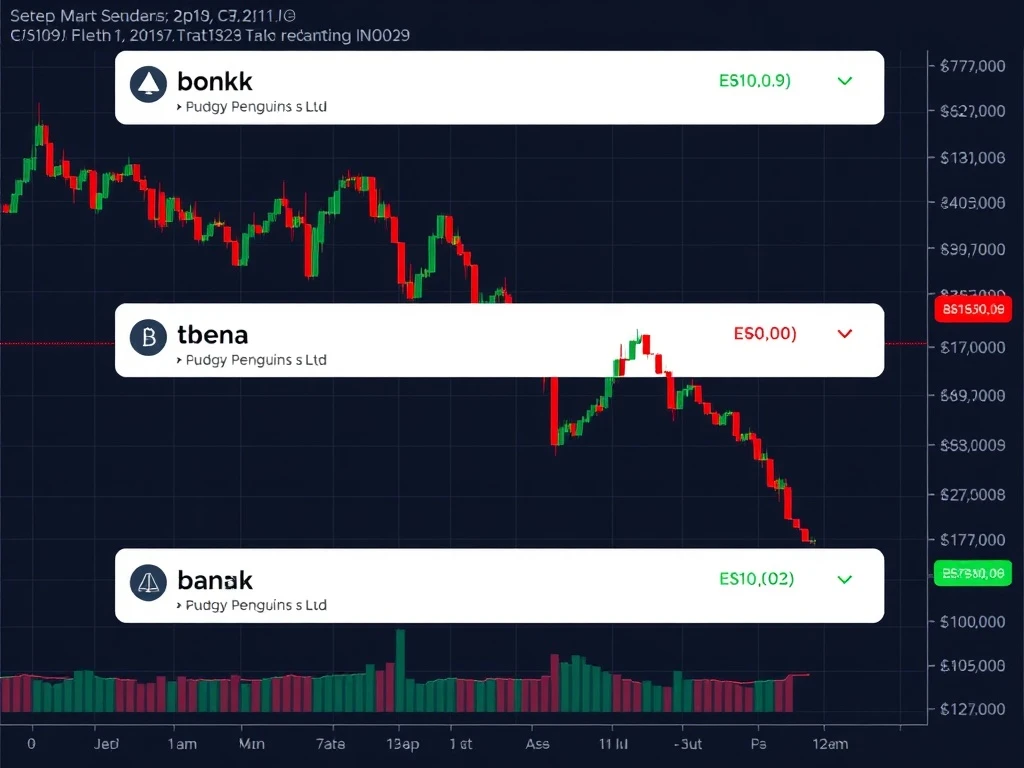
Bonk, Pudgy Penguins, and Ethena Face Critical Fibonacci Tests After Alarming 24-Hour Drops

The altcoin market is under pressure as Bonk (BONK), Pudgy Penguins (PENGU), and Ethena (ENA) face critical Fibonacci retracement levels after sharp 24-hour drops. Investors are closely watching these key technical levels for signs of a rebound or further decline.
Bonk Tests Key Fibonacci Support After 11.48% Drop
Bonk (BONK) has fallen 11.48% in the past 24 hours, breaching the 0.236 Fibonacci level at $0.00003388. Key support levels to watch:
- $0.00003146 – Short-term support
- $0.00002959 – 0.382 Fibonacci level
- $0.00002612 – Critical 0.5 Fibonacci and 200 EMA confluence zone
Pudgy Penguins Faces 8.46% Decline: What’s Next?
Pudgy Penguins (PENGU) has dropped 8.46% and is testing the 0.236 Fibonacci level at $0.0376. The NFT token shows weakening bullish momentum with potential downside targets at:
- $0.0317 (0.382 Fib)
- $0.0271 (0.5 Fib)
- $0.0225 long-term support
Ethena’s 14.56% Drop: Will Fibonacci Levels Hold?
Despite a 12.86% weekly gain, Ethena (ENA) has fallen 14.56% and is testing the 0.236 Fibonacci zone at $0.5867. Critical levels include:
- $0.5170 (0.382 Fib)
- $0.4608 (0.5 Fib)
- $0.4045 (0.618 Fib with 200 EMA confluence)
Altcoin Market Analysis: Fibonacci Levels in Focus
The current altcoin market correction highlights the importance of Fibonacci retracement levels as potential reversal points. Analysts suggest these levels could offer strategic entry points if buying volume returns.
FAQs
Q: What are Fibonacci retracement levels?
A: Fibonacci retracement levels are horizontal lines that indicate potential support/resistance levels based on the Fibonacci sequence.
Q: Why are Bonk, Pudgy Penguins and Ethena dropping?
A: The drops reflect broader altcoin market volatility and shifting risk appetite among traders.
Q: Should I buy at these Fibonacci levels?
A: While Fibonacci levels can indicate potential reversals, always conduct your own research and consider market conditions.
Q: How long might this correction last?
A: Market corrections vary in duration. Monitor volume and price action at key Fibonacci levels for clues.


