Urgent Bitcoin Price Warning: Unpacking Bearish RSI Divergence & Looming $115K Retest
The cryptocurrency market is a dynamic landscape, and when it comes to the king of cryptos, Bitcoin price movements often dictate the broader market sentiment. Currently, Bitcoin finds itself at a crucial juncture, with mounting technical indicators suggesting a potential short-term pullback. If you’re invested in crypto or just tracking its pulse, understanding these signals is paramount for navigating the evolving crypto market outlook.
The Current Bitcoin Price Puzzle: Consolidation and Uncertainty
For over ten consecutive days, Bitcoin has been consolidating within a tight range of $115,000 to $120,000, struggling to decisively break above the $120,000 mark since mid-July [1]. This period of indecision has left traders and investors weighing the likelihood of a retest of critical support levels. While the long-term bullish trend for Bitcoin appears to remain intact, the immediate future is clouded by weakening momentum and the emergence of historical price patterns that often precede corrections.
This consolidation is not unusual in a bull market, but the accompanying technical signals warrant close attention. The volume during recent attempts to push above $120,000 has been notably subdued, highlighting a lingering hesitation among market participants. Is this a healthy pause before another leg up, or a precursor to a deeper correction? Let’s dive into the specifics.
Unpacking Bearish RSI Divergence: A Critical Signal for Bitcoin Analysis
One of the most concerning technical indicators currently observed is a hidden bearish RSI divergence. The Relative Strength Index (RSI) is a momentum oscillator that measures the speed and change of price movements. A divergence occurs when the price of an asset moves in one direction while its RSI moves in the opposite direction, often signaling a potential reversal.
In Bitcoin’s current scenario, the price has been forming higher highs, but the RSI has been printing lower highs. This particular type of divergence previously emerged in March 2024, preceding a significant 20% correction in Bitcoin’s value [2]. The recurrence of this pattern raises legitimate concerns that a similar short-term decline could materialize. For anyone conducting thorough Bitcoin analysis, this is a red flag that cannot be ignored.
What does this mean for traders?
- Weakening Momentum: Despite higher prices, the underlying buying pressure is decreasing.
- Historical Precedent: Past occurrences of this divergence have led to notable pullbacks.
- Caution Advised: It suggests a higher probability of a price correction rather than a sustained upward move in the immediate term.
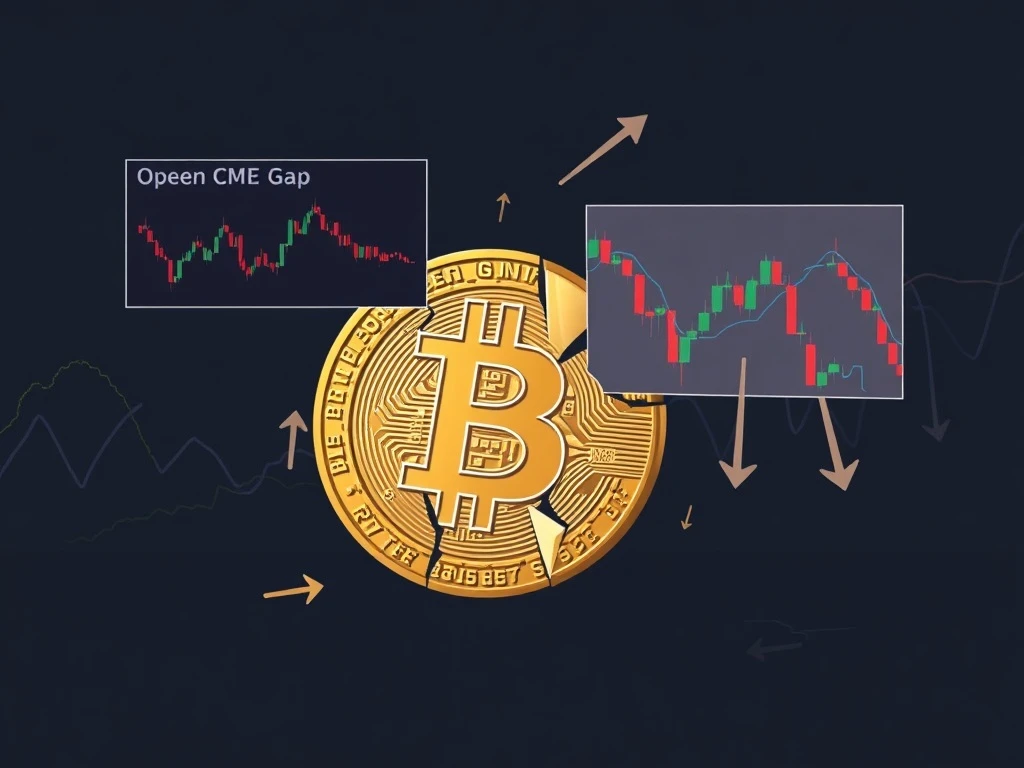
The Gravity of CME Gaps: Why $115K Beckons
Another significant factor contributing to the bearish outlook is the presence of an open CME futures gap. CME (Chicago Mercantile Exchange) Bitcoin futures gaps occur when the market opens at a different price than where it closed, leaving a ‘gap’ on the chart. Historically, Bitcoin has shown a strong tendency to ‘fill’ these gaps, meaning the price often revisits the levels where the gap occurred.
Currently, there’s an open CME gap between $114,380 and $115,635 [3]. This void, created during off-hours trading, is now a magnet for Bitcoin’s price. What makes this particularly compelling is the historical data from 2025: seven out of nine CME gaps formed this year have already been closed, amplifying the probability of a near-term revisit to the $115,000 threshold. The market’s tendency to fill these CME gaps adds a strong technical argument for a retest of this support level.
Deeper Dive into Bitcoin Analysis: On-Chain Signals and Distribution Zones
Beyond traditional technical indicators, on-chain data provides a deeper layer of insight into the market’s health and potential future movements. Anonymous crypto analyst Gaah highlighted that the Index Bitcoin Cycle Indicator (IBCI) has recently entered a ‘distribution zone’ [4]. This zone is historically associated with market peaks and heightened volatility, where larger holders might begin to offload their assets.
While the IBCI’s current reading at 80% is below the 100% levels seen during previous cycle tops, it still signals elevated corrective risk. This isn’t necessarily an ‘end-of-cycle’ signal, but rather a strong warning that caution is warranted.
Supporting Metrics: What Puell Multiple and STH-SOPR Tell Us
Further supporting this nuanced Bitcoin analysis, metrics like the Puell Multiple and STH-SOPR (Spent Output Profit Ratio for Short-Term Holders) remain below mid-levels [4].
- Puell Multiple: This metric assesses miner profitability and typically signals market tops when miners are taking significant profits. Its current position suggests miner profit-taking has not yet reached critical mass.
- STH-SOPR: This indicates whether short-term holders are selling at a profit or loss. Its current reading suggests that retail speculation and profit-taking by newer market entrants haven’t reached euphoric levels yet.
These combined signals suggest that the current phase is more of a warning signal, indicating a potential consolidation or minor correction, rather than a definitive end to the bull cycle. This is a crucial distinction for long-term investors.
Supply Active Metric: Early Signs of Distribution
Analyst Axel Adler noted that the 30-day supply active metric has edged up to +2.4% [6]. This metric tracks the percentage of Bitcoin supply that has moved in the last 30 days. While it’s a sign of early-stage distribution, it’s still far below the 18–20% peaks observed in prior bull cycles. This reinforces the idea that significant widespread selling by long-term holders or large entities is not yet occurring, but it’s a metric to monitor closely.
Navigating the Crypto Market Outlook: Key Levels and Sentiment
On-chain data from Mitrade underscores the market’s current indecision, with Bitcoin confined to its $115K–$120K range. The 50 and 100-period simple moving averages (SMAs) are clustering near $110K–$113K, reinforcing the significance of the $115K–$118K battleground as a critical support zone [5].
Key Price Levels to Watch:
- Downside Trigger: A sustained break below $115,724 could trigger a retracement towards the $113,000 level, potentially testing the SMAs.
- Upside Trigger: A decisive close above $122,000 might reignite a push towards the $130,000 mark, validating a continuation of the uptrend.
The price action in late July reflects cautious optimism mixed with underlying concerns. Despite an intraday dip to $117,634 on July 24, Bitcoin has managed to hold above key SMAs, albeit with declining volume. This pattern is often typical of healthy consolidation, where weak hands are shaken out before a stronger move. However, the lack of strong volume during recent $120K attempts highlights lingering hesitation among traders [7].
Market participants remain divided: some view a $115K retest as a necessary and healthy shakeout before a potential surge towards $135K, while others argue that the $117K–$120K range offers sufficient support to prevent a deeper dip [7]. The broader market remains in a transitional phase, with Bitcoin’s performance heavily influencing other risk assets. A breakout above $122,000, particularly if accompanied by renewed ETF inflows or positive macroeconomic catalysts, could reignite bullish momentum across the entire crypto space. However, the current lack of conviction underscores the need for further clarity and decisive price action.
Conclusion: The Pivotal $115K Threshold for Bitcoin Price
As the market digests these complex signals, the $115,000 threshold stands out as pivotal in determining Bitcoin’s next directional move. The confluence of bearish RSI divergence, the magnetic pull of open CME gaps, and the IBCI entering a distribution zone paints a cautious near-term crypto market outlook. While the long-term bullish narrative for Bitcoin remains robust, traders and investors should prepare for potential volatility and a possible retest of lower support levels. Staying informed and agile will be key to navigating this dynamic phase of the market.
Frequently Asked Questions (FAQs)
Q1: What is a bearish RSI divergence and why is it significant for Bitcoin?
A bearish RSI divergence occurs when Bitcoin’s price makes higher highs, but its Relative Strength Index (RSI) makes lower highs. This indicates that despite price increases, the underlying momentum is weakening, often signaling a potential reversal or correction. It’s significant because a similar pattern preceded a 20% correction in March 2024.
Q2: What are CME gaps and how do they influence Bitcoin’s price?
CME gaps are price discrepancies that occur on the Chicago Mercantile Exchange’s Bitcoin futures chart, typically when the market opens at a different price than its previous close. Historically, Bitcoin’s price has shown a strong tendency to ‘fill’ these gaps, meaning it often revisits those price levels. The current open gap between $114,380 and $115,635 is seen as a magnetic target for Bitcoin’s price.
Q3: Does the current market outlook suggest an end to Bitcoin’s bull run?
Not necessarily. While indicators like the IBCI entering a ‘distribution zone’ and bearish RSI divergence suggest elevated corrective risk and potential short-term pullbacks, supporting metrics like the Puell Multiple and STH-SOPR are not yet signaling a definitive end-of-cycle top. This phase is more likely a warning for consolidation or a minor correction rather than a complete reversal of the long-term bull trend.
Q4: What are the key price levels Bitcoin needs to hold or break for its next move?
Bitcoin is currently consolidating between $115,000 and $120,000. A sustained break below $115,724 could lead to a retracement towards $113,000. Conversely, a decisive close above $122,000 might reignite a push towards $130,000, signaling a continuation of the bullish momentum.
Q5: How do on-chain metrics like ‘supply active’ contribute to Bitcoin analysis?
The ‘supply active’ metric tracks the percentage of Bitcoin supply that has moved within a specific timeframe (e.g., 30 days). An increase, like the recent +2.4%, can signal early-stage distribution, meaning some holders might be selling. While it’s a warning, the current level is far below peaks seen in prior bull cycles, suggesting widespread selling by long-term holders is not yet happening.
Q6: Should investors be concerned about the current Bitcoin price movements?
Investors should remain cautious and informed. The technical signals indicate a higher probability of a short-term pullback or consolidation. While the long-term outlook remains positive for many, understanding these warning signs allows for better risk management and strategic positioning. It’s a time for vigilance rather than panic.


