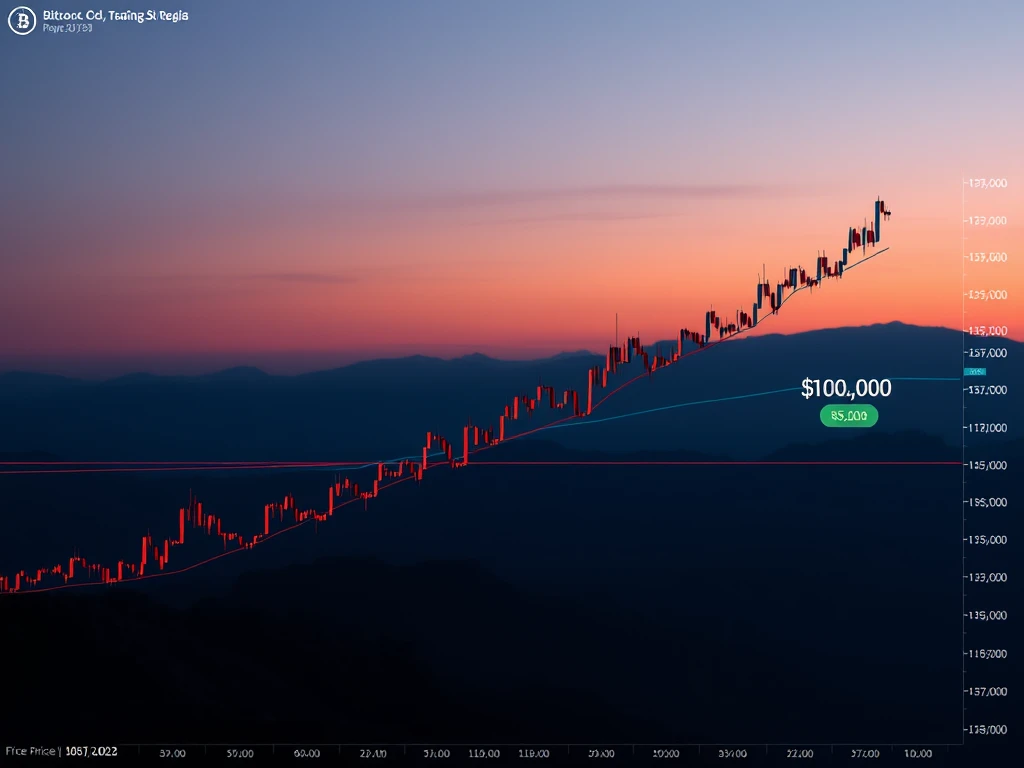
Bitcoin Price: Traders Target $100K Amidst Crucial Market Signals

Attention, crypto enthusiasts! The Bitcoin price is making headlines again, sealing an 11% gain in May. But while the monthly close brought cheers, Bitcoin traders are already looking ahead, with eyes firmly fixed on the weekly close and potential moves towards the significant $100,000 level and below.
What Are Bitcoin Traders Watching Right Now?
Bitcoin traders are currently focused on the weekly chart for clues on the next direction for BTC price action. Despite the strong monthly performance, recent days have seen the price pull back, bringing it into contact with important support levels established earlier in the bull market. A key level is the prior local top from December 17, 2024, around $104,450. The weekly close relative to this level is considered pivotal by market observers.
Why Is RSI Divergence Causing Concern?
A significant technical signal gaining attention is a potential bearish divergence on the weekly Relative Strength Index (RSI). The RSI is a momentum indicator. When price makes higher highs but the RSI makes lower highs, it can suggest weakening momentum, potentially preceding a price correction.
- A popular trader noted the potential divergence between Bitcoin price and the weekly RSI.
- Another analyst warned that this signal, if confirmed, could have broader implications for the current bullish trend.
- This RSI divergence suggests that despite recent price strength, the underlying momentum might be slowing.
While currently unconfirmed, this RSI divergence is a key factor influencing trader sentiment and Market analysis.
Are Lower Levels Like $100K and $97K Realistic Targets?
Yes, Bitcoin traders are indeed targeting levels below the current price, including the psychologically important $100,000 mark. Market analysis based on factors like order book liquidity suggests that $100,000 could act as a price magnet if selling pressure increases. Liquidity tends to accumulate around such round numbers, making them potential points of interest for price movement.
Beyond $100,000, traders are also identifying other areas of interest based on technical tools like Fibonacci retracement levels and fair value gaps (FVGs). These imbalances between buyers and sellers have created zones that price might revisit. Two notable FVG zones are:
- $97,000
- $90,000
After a substantial run-up (over 50%), a period of consolidation or a healthy pullback wouldn’t be unexpected and could contribute to a stronger market structure moving forward.
Does This Mean the Bull Market Is Over?
Despite the focus on potential downside targets, many analysts maintain a positive outlook on the overall trend. While a temporary drop to $100,000 or even slightly below to ‘shake out’ the market is considered possible, the broader bull market structure is seen as intact.
The bull market support level, currently around $84,000, is still moving upwards and is considered a strong foundation. As long as key support levels hold and the overall market structure remains constructive, dips are viewed by many as potential buying opportunities rather than signs of a market top.
Summary: Navigating the Current BTC Price Landscape
The BTC price closed May with a solid 11% gain, yet Bitcoin traders remain cautious, closely watching the weekly close and technical signals. The potential weekly RSI divergence is a key point of concern, suggesting momentum might be waning.
Market analysis indicates that levels like $100,000, $97,000, and $90,000 are on traders’ radar as potential targets for a pullback. However, the underlying market structure is still considered bullish by many, with significant support levels well below the current price. Navigating this period requires careful observation of key levels and technical indicators.
Disclaimer: This article provides market commentary and analysis. It does not constitute investment advice. Trading cryptocurrencies involves risk. Conduct your own research before making investment decisions.


