Bitcoin Price: Unveiling Crucial Resilience After an 8.37% Dip

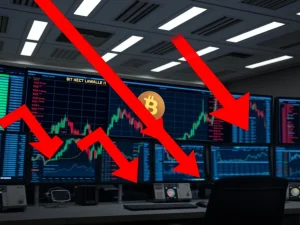
The crypto market often keeps us on our toes, and recent movements for Bitcoin price and XRP are no exception. After a significant surge, both assets experienced an 8.37% drop, sparking immediate questions about market direction. But before you hit the panic button, let’s dive into why this pullback might be a healthy consolidation rather than a reversal, and what the technical indicators are truly signaling for the broader Bitcoin uptrend.
Why Did Bitcoin Price & XRP See a Sudden Dip?
The recent dip in both Bitcoin price and XRP might seem alarming at first glance, but it’s a classic case of profit-taking. After reaching an impressive high near $121,000, Bitcoin retreated to $117,763. Similarly, XRP, which recently hit an all-time high near $3.60, saw an 8.37% decline in 24 hours, settling at $3.25. This behavior is entirely normal after rapid gains, as early investors and traders look to lock in their profits. Think of it as the market taking a necessary breather after a sprint.
It’s important to distinguish between a healthy market correction and a full-blown reversal. When assets experience parabolic rises, a period of consolidation or a slight pullback is often expected and even beneficial. It allows the market to digest the gains, shake out weaker hands, and prepare for the next leg up. The key is to look beyond the immediate red candles and analyze the broader context, which is exactly what we’ll do in our crypto market analysis.
Decoding the Crypto Market Analysis: Is This Just Profit-Taking?
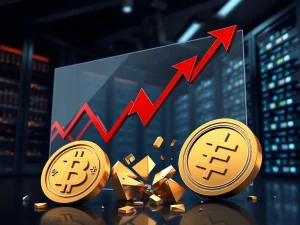
Our deep dive into the current crypto market analysis strongly suggests that this recent dip is indeed a phase of healthy consolidation, largely driven by profit-taking, rather than a fundamental shift in market sentiment. The overall sentiment remains robust, as reflected by the Crypto Fear & Greed Index, which holds steady at 70. This score indicates a sustained ‘Greed’ level, signaling that market participants are still largely optimistic about future price movements.
Furthermore, a significant majority of users on platforms like Myriad (over 70%) are predicting that Bitcoin price could reach $125,000 before a potential dip to $105,000. This collective sentiment reinforces the idea that the current pullback is viewed as a temporary correction within a larger bullish cycle.
Looking at Bitcoin’s daily chart, despite the red candle closing at $117,763, the asset has successfully maintained its position above crucial support levels, notably $112,000. More importantly, Bitcoin continues to trade well above its key moving averages. The 50-day Exponential Moving Average (EMA) is positioned at $110,976, and the 200-day EMA is at $88,217. This favorable alignment, where shorter-term averages are comfortably above longer-term ones, is often referred to as a “golden” alignment. It’s a powerful technical signal that reinforces the likelihood of a sustained Bitcoin uptrend rather than a reversal.
Technical Indicators: Confirming the Bitcoin Uptrend Continuity
Beyond price action and market sentiment, technical indicators provide objective data that further support the bullish case for a continued Bitcoin uptrend. These tools help us understand the underlying strength and direction of the market, even during periods of volatility:
- Average Directional Index (ADX): For Bitcoin, the ADX currently stands at 29. This is significant because any reading above 25 confirms the strength of an existing trend. The fact that Bitcoin’s ADX is above this threshold indicates that the underlying uptrend remains intact despite the recent pullback.
- Relative Strength Index (RSI): On the daily timeframe, Bitcoin’s RSI is at 60. This level is crucial because it avoids the oversold territory (typically below 30), suggesting that there’s still room for consolidation without undermining the broader move higher. An RSI of 60 indicates healthy momentum without being excessively overbought, allowing for natural market corrections.
- XRP’s ADX: XRP boasts an even higher ADX reading of 54. This signals what analysts often call a “power trend,” where corrections are typically short-lived and quickly bought up. Despite today’s 8.37% decline, XRP’s price remains remarkably resilient, trading 25% above its 50-day EMA ($2.63). This demonstrates strong underlying demand even in the face of temporary dips.
While the Squeeze Momentum Indicator shows slightly bearish momentum for Bitcoin price on the daily timeframe, consistent with today’s red candle, isolated metrics like this should be interpreted cautiously. They often indicate a compression phase – a period of low volatility before a significant move – rather than a structural shift in the market. Similarly, XRP’s RSI at 66 reflects a healthy pullback from overbought levels but remains firmly in bullish territory, signaling a digestion of gains rather than a reversal.
Crucial Levels to Watch for Bitcoin Price and XRP
Understanding key support and resistance levels is vital for navigating the market, especially during periods of volatility. Here’s what to watch for Bitcoin price and XRP price:
Bitcoin (BTC) Key Levels:
- Immediate Support: $115,000
- Strong Support: $112,000 (a critical psychological and technical level)
- Immediate Resistance: $121,000 (the level it failed to break above recently)
- All-Time High Resistance: $123,091
XRP (XRP) Key Levels:
- Current Support: $3.25 (aligns with the 23.6% Fibonacci retracement level)
- Strong Support Zone: $3.00 (a significant psychological level)
- Immediate Resistance: $3.60 (the recent all-time high)
Monitoring these levels will provide crucial insights into potential price movements and help traders identify entry and exit points.
Beyond the Charts: Fundamental Factors Driving Long-Term Growth
While technical indicators offer a snapshot of market sentiment and price action, fundamental factors provide the long-term backbone for a sustained Bitcoin uptrend and overall crypto market growth. Several key developments are currently underpinning optimism:
- JPMorgan’s Crypto-Backed Loan Initiative: The ongoing initiative by a major financial institution like JPMorgan to offer crypto-backed loans is a significant validation. It legitimizes Bitcoin and XRP as credible collateral assets, signaling growing institutional acceptance and integration into traditional finance. This move could unlock substantial liquidity and attract more institutional capital.
- The GENIUS Act: The recent passage of the GENIUS Act is a game-changer for regulatory clarity, particularly for U.S. stablecoin issuers. Regulatory certainty is a critical catalyst for broader adoption, as it reduces uncertainty for institutional investors and fosters a more stable environment for innovation.
Analysts widely suggest that these fundamental developments could attract significant capital inflows from traditional markets into the crypto space. As regulatory frameworks become clearer and institutional interest deepens, the foundations for a robust and expanding crypto ecosystem are being solidified, supporting the long-term bullish outlook for assets like Bitcoin and XRP, even amidst short-term profit-taking.
Conclusion: A Healthy Pause, Not a Reversal
The recent 8.37% dip in Bitcoin price and XRP price, while grabbing headlines, appears to be a healthy market correction driven by natural profit-taking. Our comprehensive crypto market analysis, supported by strong technical indicators like ADX and RSI, confirms that the underlying Bitcoin uptrend remains robust. With key support levels holding firm and significant fundamental tailwinds like institutional validation and regulatory clarity, the market seems poised for continued growth. This dip offers a valuable opportunity for those looking to understand the resilience of these leading digital assets.
Stay informed, watch the key levels, and remember that market volatility is a normal part of the crypto journey. The long-term outlook remains bright for those who understand the underlying dynamics.
Frequently Asked Questions (FAQs)
1. Is the recent drop in Bitcoin and XRP a sign of a bear market?
Based on current technical indicators and market sentiment (like the Fear & Greed Index at 70), the recent drop is primarily attributed to profit-taking after significant gains. It appears to be a healthy consolidation within a broader uptrend rather than the start of a bear market.
2. What is “profit-taking” in cryptocurrency markets?
Profit-taking is a common market behavior where investors sell off a portion or all of their assets after a period of significant price appreciation. They do this to lock in their gains, leading to a temporary downward pressure on prices.
3. How do technical indicators like ADX and RSI support a Bitcoin uptrend?
The Average Directional Index (ADX) at 29 for Bitcoin confirms the strength of the existing trend, indicating the uptrend is still intact. The Relative Strength Index (RSI) at 60 suggests the asset is not oversold and has room for consolidation without reversing the broader move higher, reinforcing the Bitcoin uptrend narrative.
4. What fundamental factors are currently supporting Bitcoin and XRP?
Key fundamental factors include JPMorgan’s crypto-backed loan initiative, which validates Bitcoin and XRP as collateral, and the recent passage of the GENIUS Act, providing regulatory clarity for U.S. stablecoin issuers. These developments are expected to attract significant capital inflows from traditional markets.
5. What are the key support levels for Bitcoin and XRP after this pullback?
For Bitcoin, immediate support is at $115,000, with strong support at $112,000. For XRP, current support is at $3.25, with a strong support zone around $3.00. These levels are crucial to watch for potential rebounds.