Urgent Bitcoin Price Plunge: Shocking Dip and Key Levels to Watch

Hold onto your hats, crypto enthusiasts! The Bitcoin rollercoaster has taken another dramatic dip. If you woke up today and checked your portfolio, you might have felt a jolt as you saw Bitcoin’s price taking a significant hit. The big question on everyone’s mind right now is: how low can the Bitcoin price go? Let’s dive into the current market situation, analyze the potential bottom, and explore what this means for your crypto holdings.
Why is the Bitcoin Price Plunging?
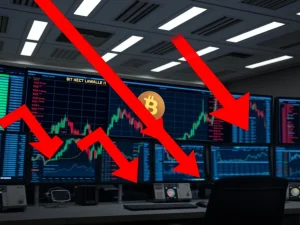
Bitcoin’s recent 6% drop, breaching the critical $90,000 mark, has sent ripples of concern throughout the crypto market. But what’s fueling this sudden downturn? Several factors could be at play, contributing to the current Bitcoin price volatility:
- Profit-Taking After a Bull Run: Bitcoin has experienced a significant surge in recent months. After such impressive gains, it’s natural for some investors to take profits, leading to selling pressure and a price correction.
- Market Sentiment and Fear: Negative news or broader economic concerns can quickly shift market sentiment. Fear, Uncertainty, and Doubt (FUD) can trigger sell-offs, exacerbating price drops.
- Potential Regulatory Scrutiny: Rumors or actual announcements of increased regulatory scrutiny in major economies can spook investors and lead to market corrections.
- Macroeconomic Factors: Global economic conditions, inflation concerns, interest rate hikes, and geopolitical events can all impact investor risk appetite and influence the BTC price.
- Whale Activity: Large Bitcoin holders (whales) making significant trades can trigger price fluctuations and market volatility.
Bitcoin Price Prediction: How Low Could BTC Dip?
Predicting the exact bottom of a Bitcoin dip is notoriously difficult, even for seasoned analysts. However, we can look at technical analysis, historical price movements, and market indicators to identify potential support levels and possible scenarios. Here are some key points to consider:
| Scenario | Potential Support Level | Factors to Watch |
|---|---|---|
| Moderate Correction | $85,000 – $88,000 | Strong buying interest at these levels, positive news flow returning, stabilization of broader markets. |
| Deeper Correction | $80,000 – $83,000 | Break below $85,000 with high volume, continued negative news, increased selling pressure. |
| Bearish Scenario | Below $80,000 (potential for retesting previous lows, though less likely in current market) | Severe negative black swan event, widespread panic selling, significant regulatory crackdown. |
It’s crucial to remember that these are just potential scenarios. The actual BTC price movement can be influenced by a multitude of unpredictable factors. Always conduct your own research and consider your risk tolerance before making any investment decisions.
Analyzing the Crypto Market Correction: Is This a Buying Opportunity?
Market corrections, while unsettling, are a natural part of any market cycle, including the cryptocurrency market. Many seasoned investors view these crypto market correction periods as potential buying opportunities. Why? Because:
- Discounted Prices: Corrections allow you to buy Bitcoin and other cryptocurrencies at lower prices than during market peaks.
- Long-Term Growth Potential: If you believe in the long-term potential of Bitcoin and the crypto market, a dip can be a chance to accumulate more assets at a better value.
- Market Reset: Corrections can help to cool down overheated markets and set the stage for more sustainable future growth.
However, it’s essential to approach this cautiously. Bitcoin analysis suggests that timing the market bottom perfectly is almost impossible. A strategy like dollar-cost averaging (DCA), where you invest a fixed amount at regular intervals, can be a less risky approach during volatile periods. This strategy helps to average out your purchase price over time, reducing the impact of short-term price fluctuations.
Navigating Bitcoin Price Volatility: Actionable Insights for Investors
The cryptocurrency market is known for its volatility, and Bitcoin price swings are part of the game. Here are some actionable insights to help you navigate these turbulent times:
- Stay Informed: Keep up-to-date with market news, technical analysis, and expert opinions. Reliable crypto news sources and analytics platforms can be invaluable.
- Manage Your Risk: Never invest more than you can afford to lose. Diversify your portfolio and don’t put all your eggs in one basket.
- Develop a Strategy: Have a clear investment strategy and stick to it. Avoid making impulsive decisions based on short-term market fluctuations.
- Consider Long-Term Perspective: Focus on the long-term potential of Bitcoin and blockchain technology rather than getting caught up in short-term price swings.
- Use Risk Management Tools: Explore tools like stop-loss orders (use with caution in volatile markets) to help manage potential downside risks.
- Stay Calm: Emotional decision-making can be detrimental in investing. Try to remain calm and rational during market downturns.
Conclusion: Is the Bitcoin Price Crash a Buying Opportunity or a Warning Sign?
The recent Bitcoin price plunge is undoubtedly a significant market event. Whether it’s a temporary dip or the start of a deeper correction remains to be seen. However, for informed investors with a long-term perspective, market corrections can present compelling buying opportunities. By staying informed, managing risk effectively, and maintaining a rational approach, you can navigate the volatility of the crypto market and potentially benefit from the future growth of Bitcoin and the digital asset space. Remember to always do your own research and invest wisely!